How To ..
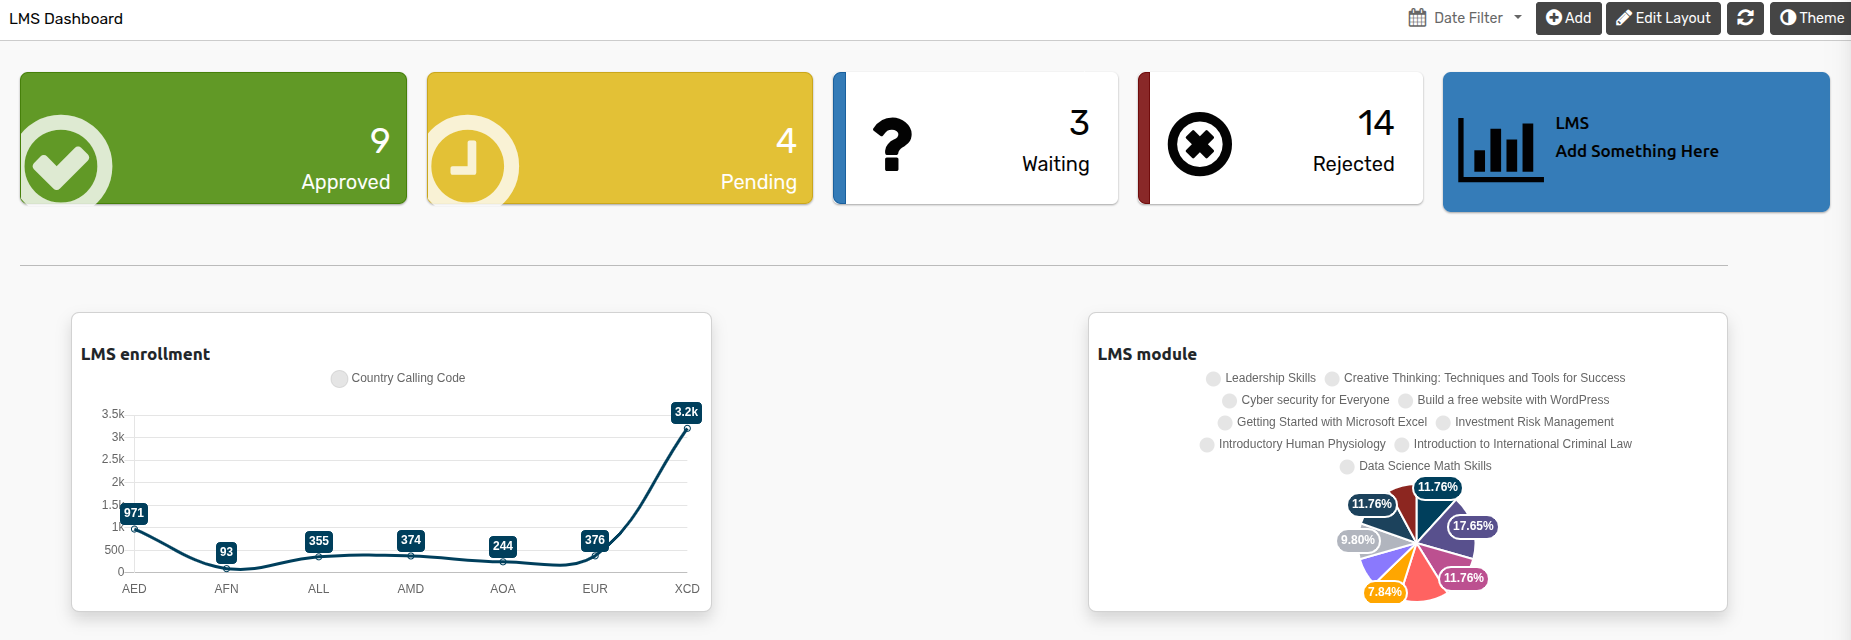
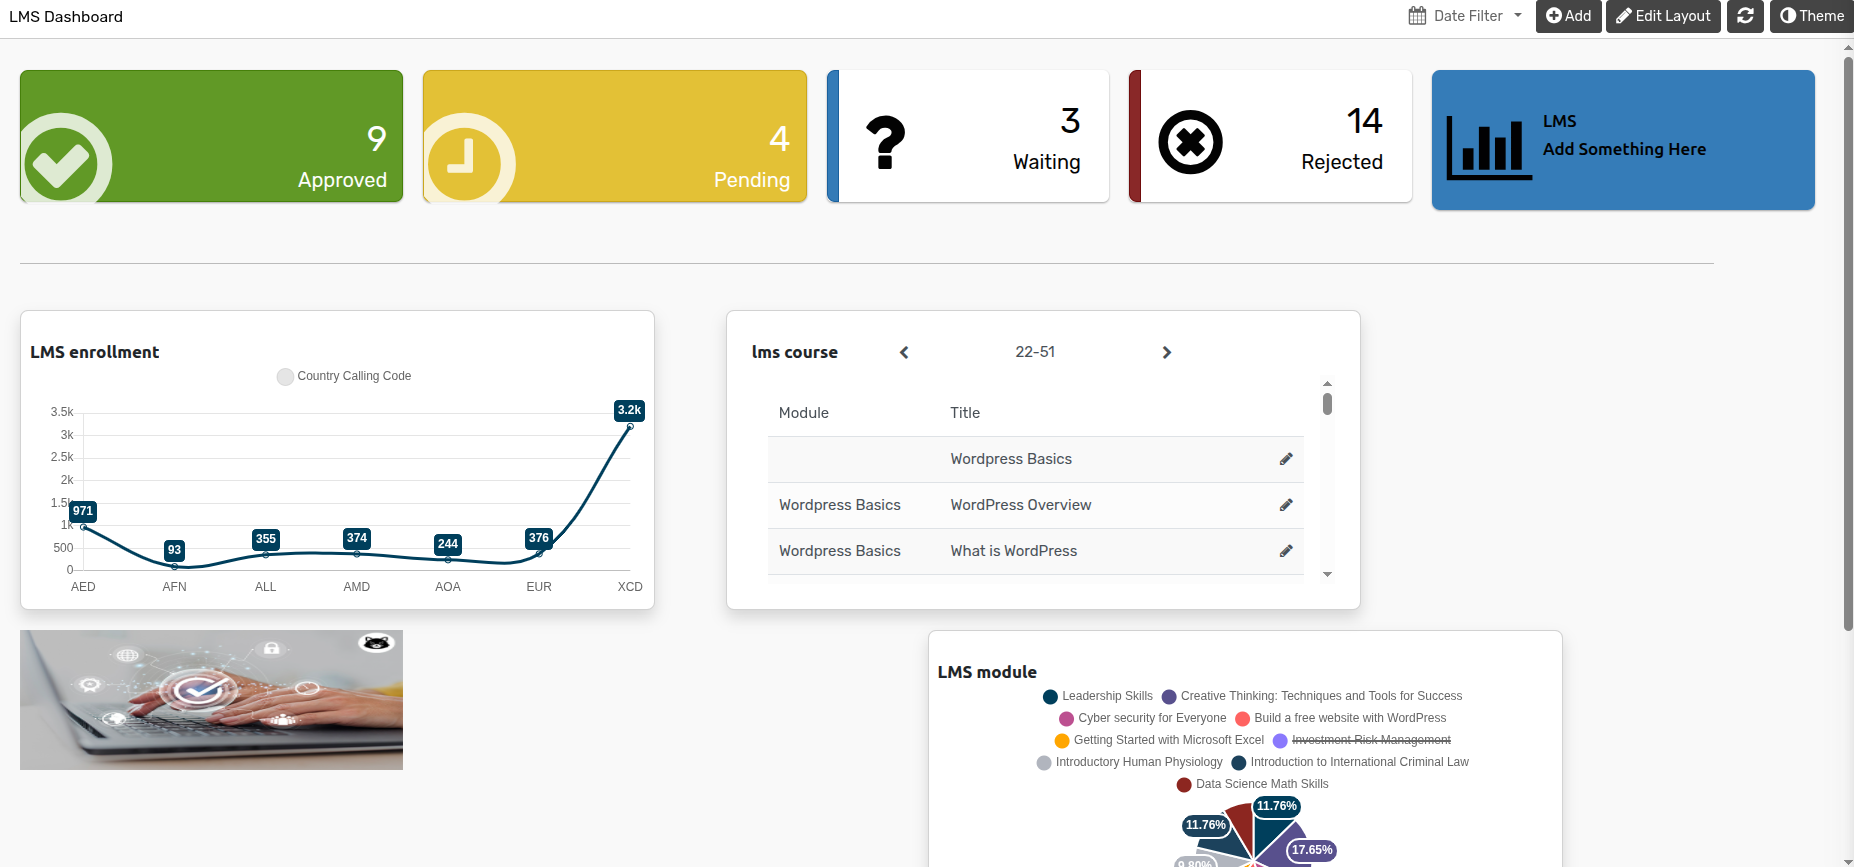
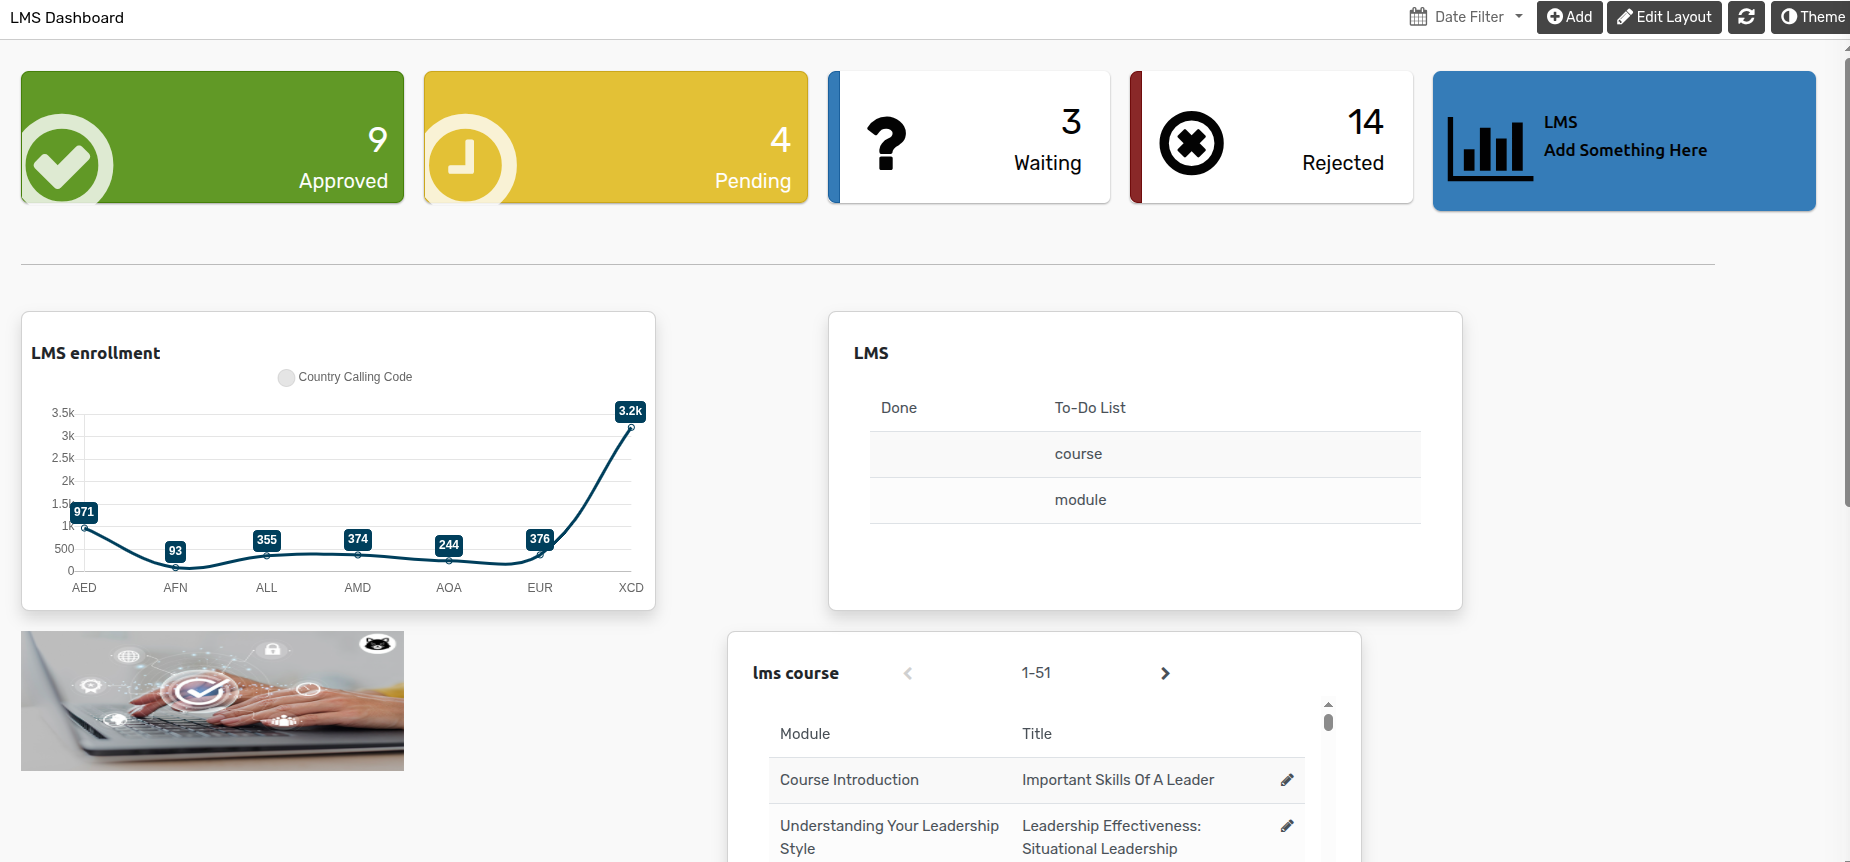
KPI Dashboard helps you make eye on your important data easily. It contains multiple tile view, Kpi view, List view, multiple Chart view.
How to make Charts
You can go to the .
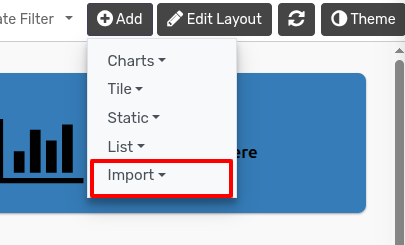
Click on Add button to add charts.
Dashboard Pro Provide Multiple Types Of Charts Like Bar, Horizontal Bar, Line, Area, Pie, Doughnut, Polar Area.
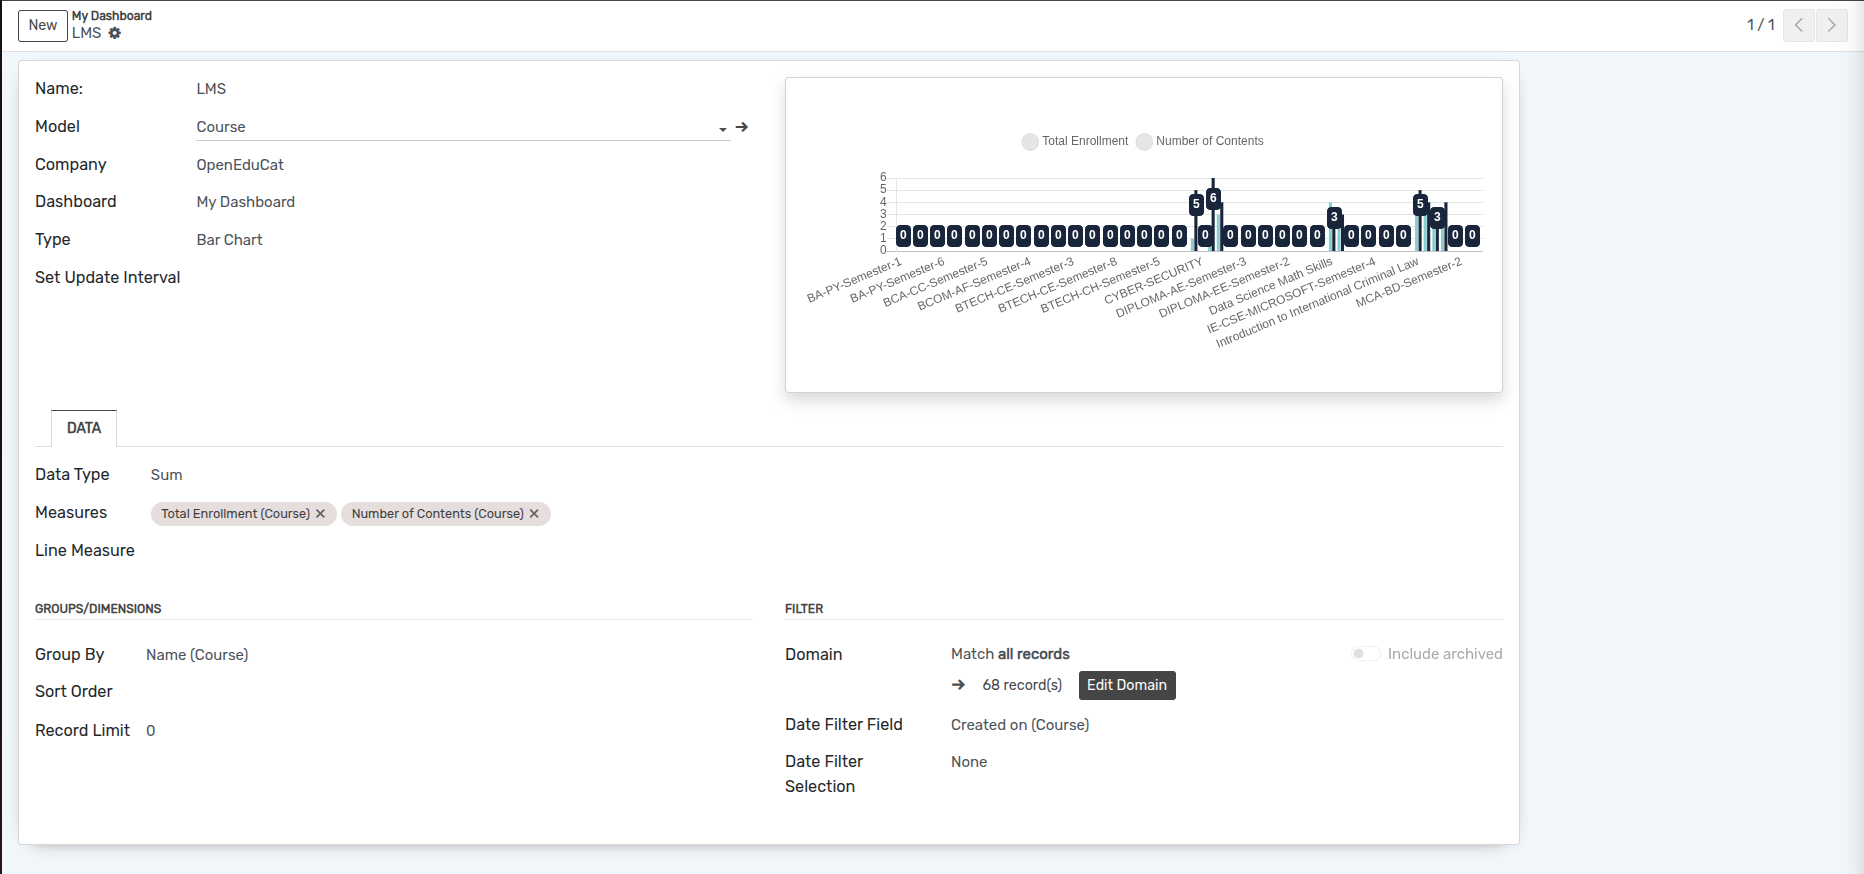
Name :- Specify the name of chart.
Model :- Select the model from the list.
Company :- Select the Company from the list.
Dashboard :- Select the dashboard from the list.
Type :- Select the type of chart from the list.
Set Update Interval :- Set the update interval time in set update interval field.
Pages
Data
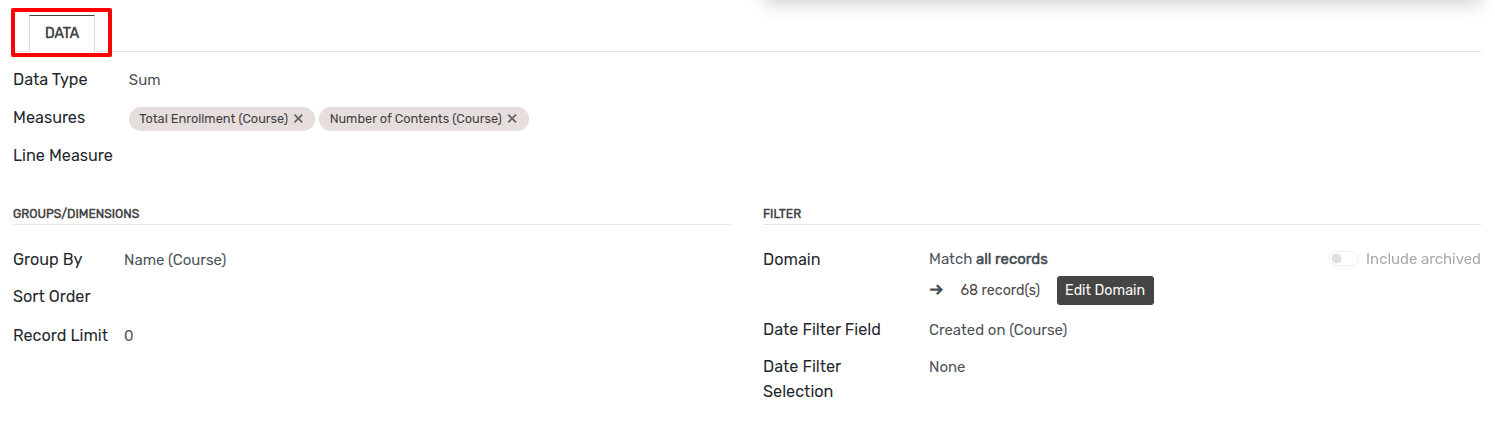
Data type :- select the data type which is sum, count or avarage from the list.
Measures :- Select the Measures of the selected model from the list.
Line Measure :- Select the Line Measures of the selected model from the list.
Group By :- Select the group by which you want to group from the list.
Sort By Field :- Select the sort by field from the list.
Sort Order :- Select the sort order which is Ascending or Descending.
Record Limit :- Add the record limit as you want to display.
Domain :- Add domain for current chart.
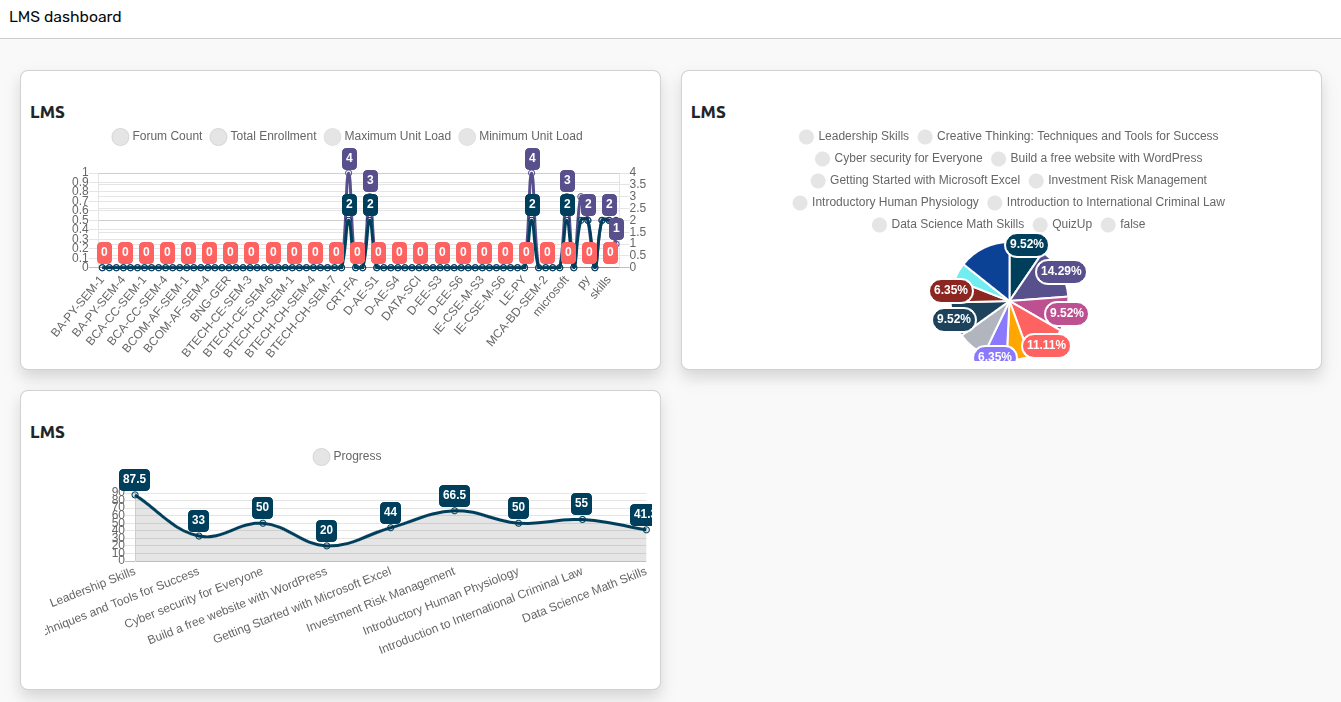
In this way you can make multiple charts with different types.
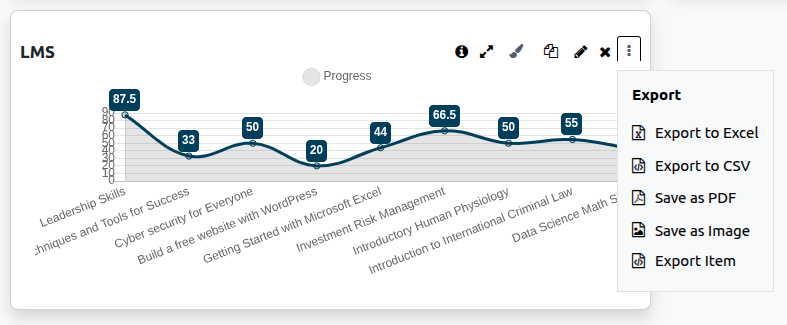
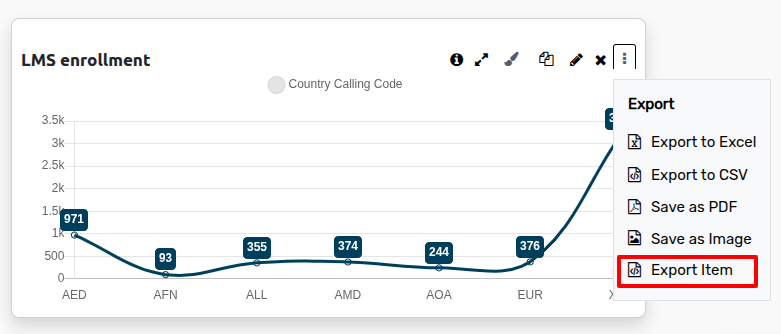
You Can Export Chart As Excel, Csv, PDF, Image And Json. Json File Can Be Imported In Dashboard Later.
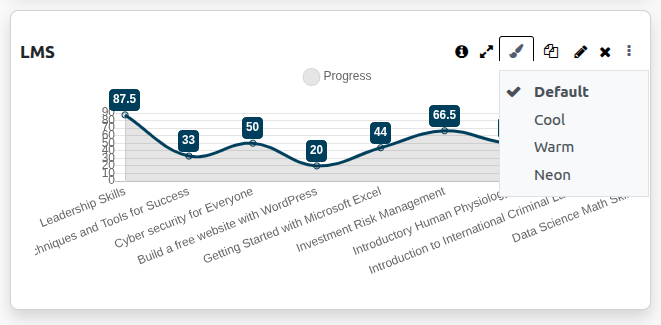
KPI Dashboard Features 4 Different Colouring Options.
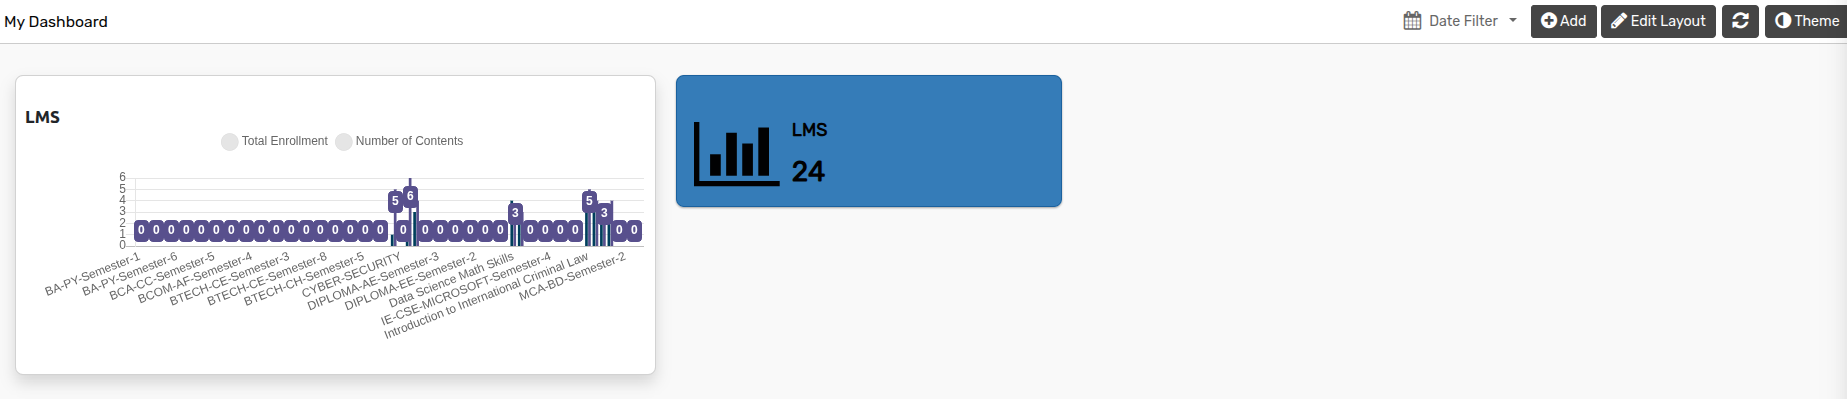
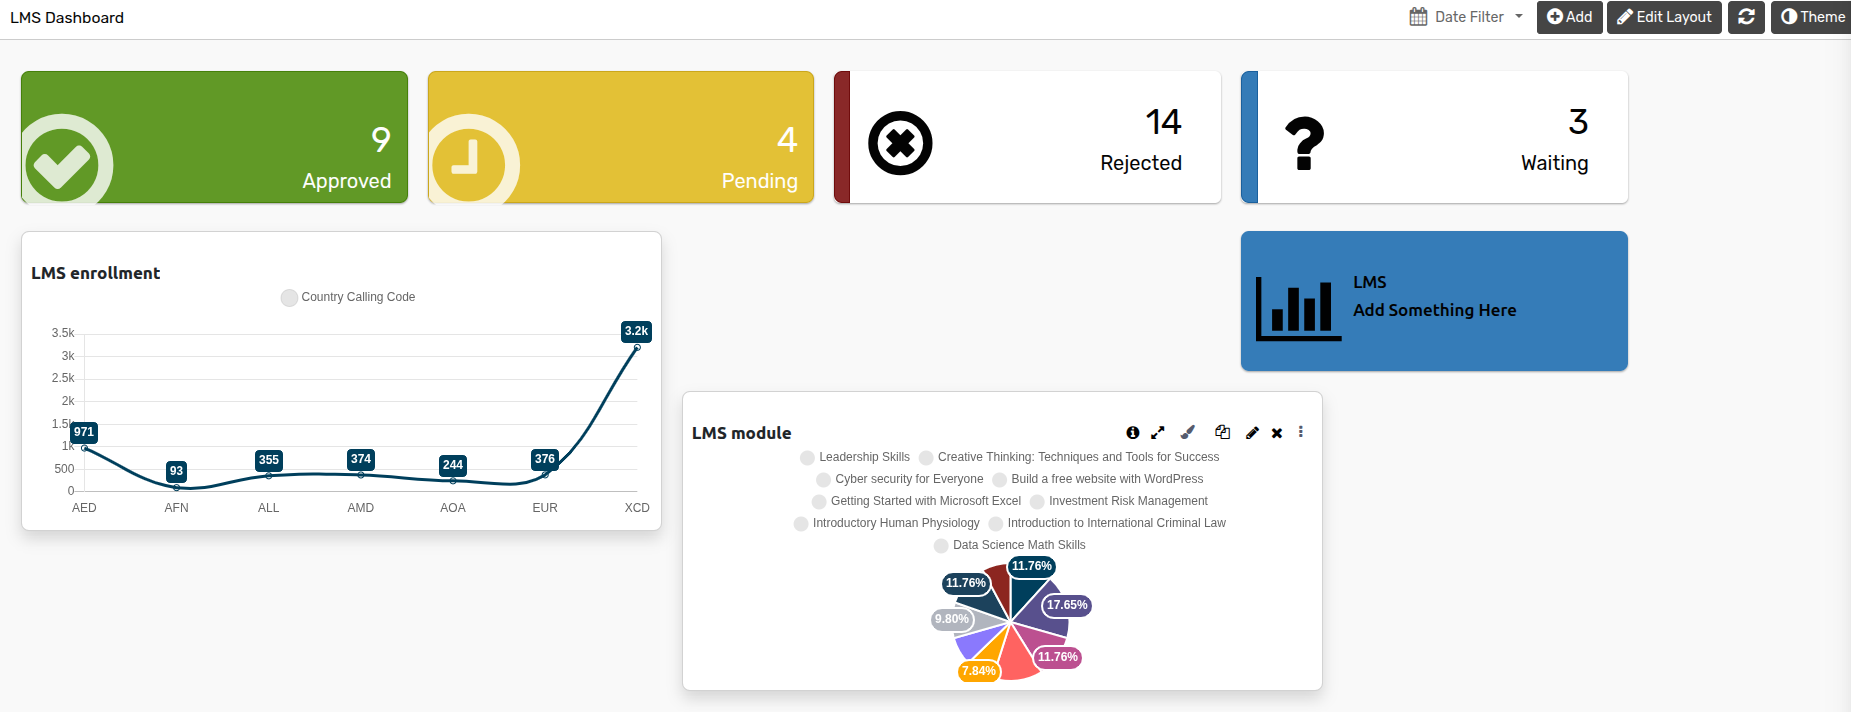
How to make Tiles
KPI Dashboard Provides Different Elements Like Tile View & KPI View. There Is 6 Stunning And Good Looking Tile Layouts.
Name :- Specify the name of tile.
Model :- Select the model from the list.
Company :- Select the Company from the list.
Dashboard :- Select the dashboard from the list.
Pages
Data
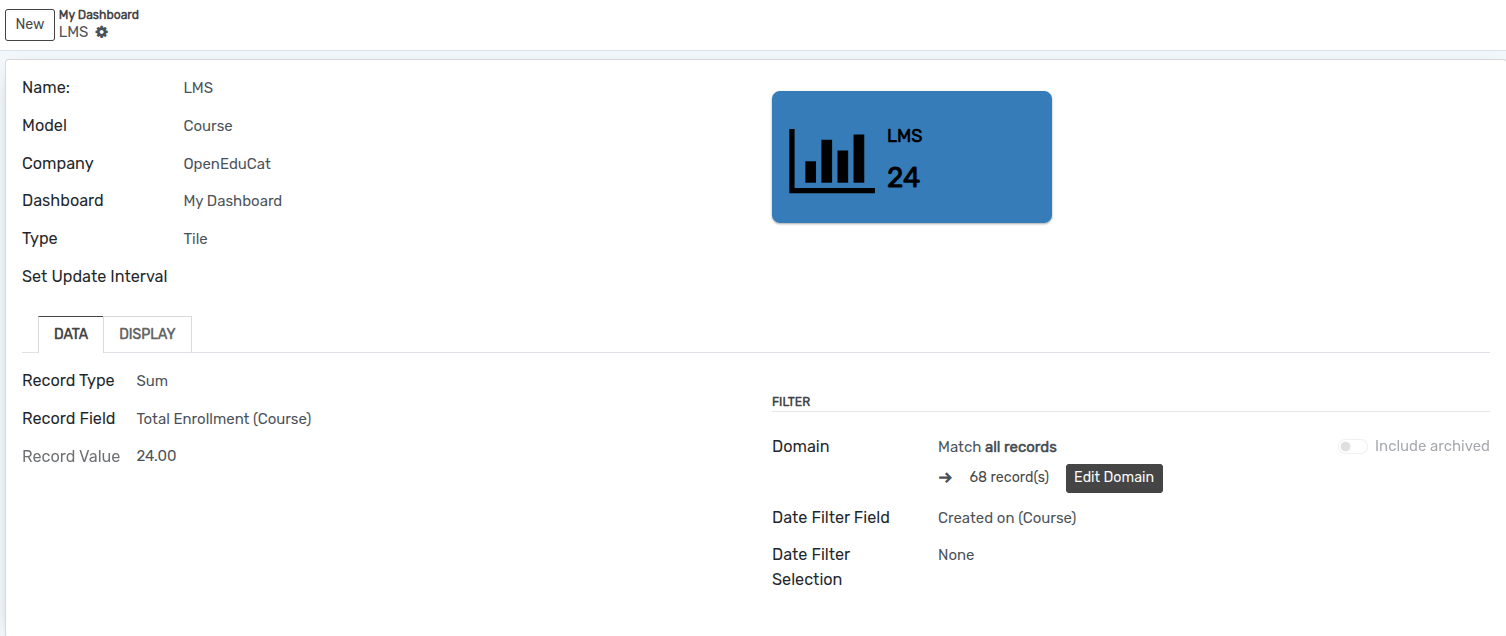
KPI Dashboard Let You Customize Menu Title And It’s Value From Different Models In Data Tab. In KPI View You Can Select Between Progress Bar Or Percent In Target Tab. Also You Can Compare With Another Model in Sum , Ratio And Percentage.
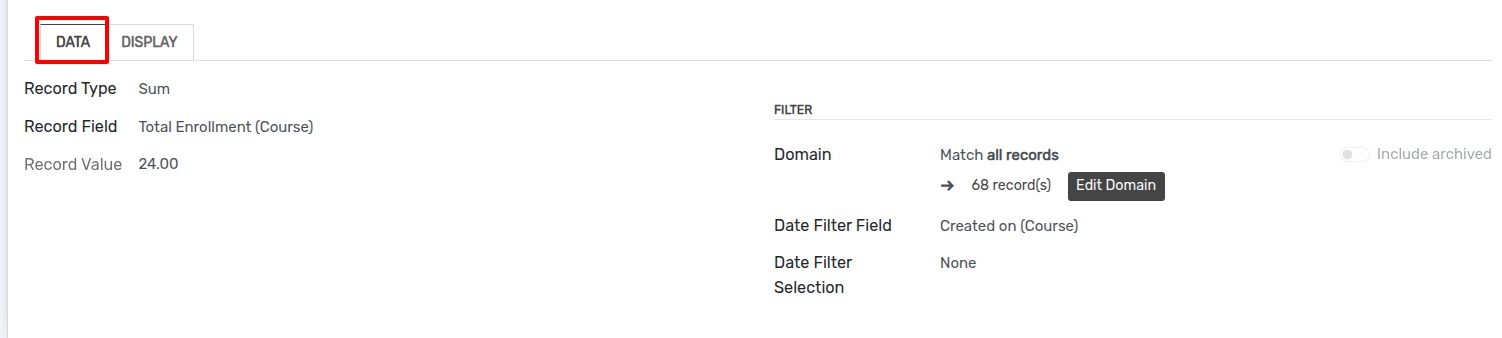
Record Type :- select the data type which is sum, count or avarage from the list.
Record Field :- Select the Record Field based on selected model from the list.
Record Value :- It will automatically add based on selected record field.
Domain :- Add domain for current tile.
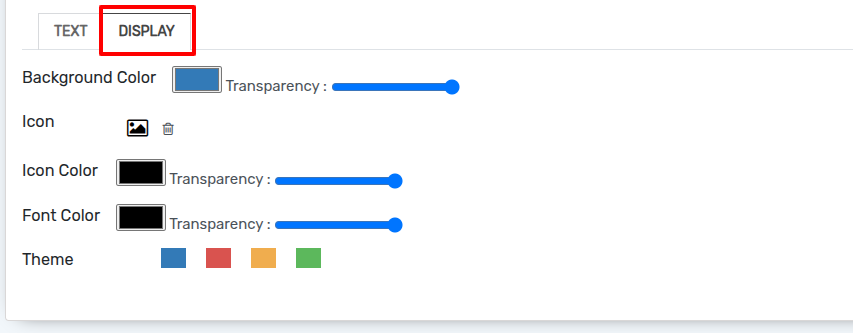
Display
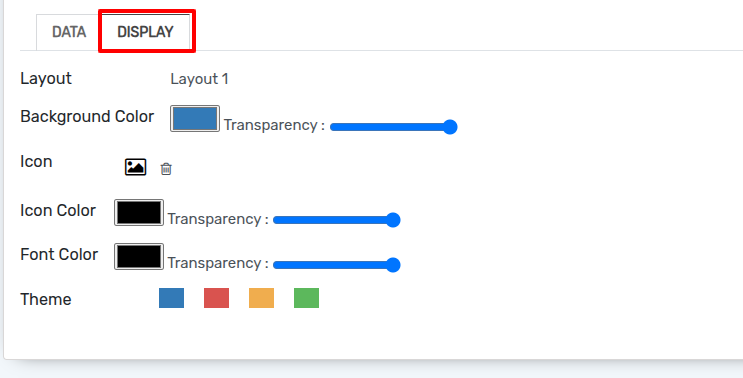
KPI Dashboard provides to select different icon from font awesome and also let you select your favourite color.It also let you select color for font and background from display tab.
How to make KPI
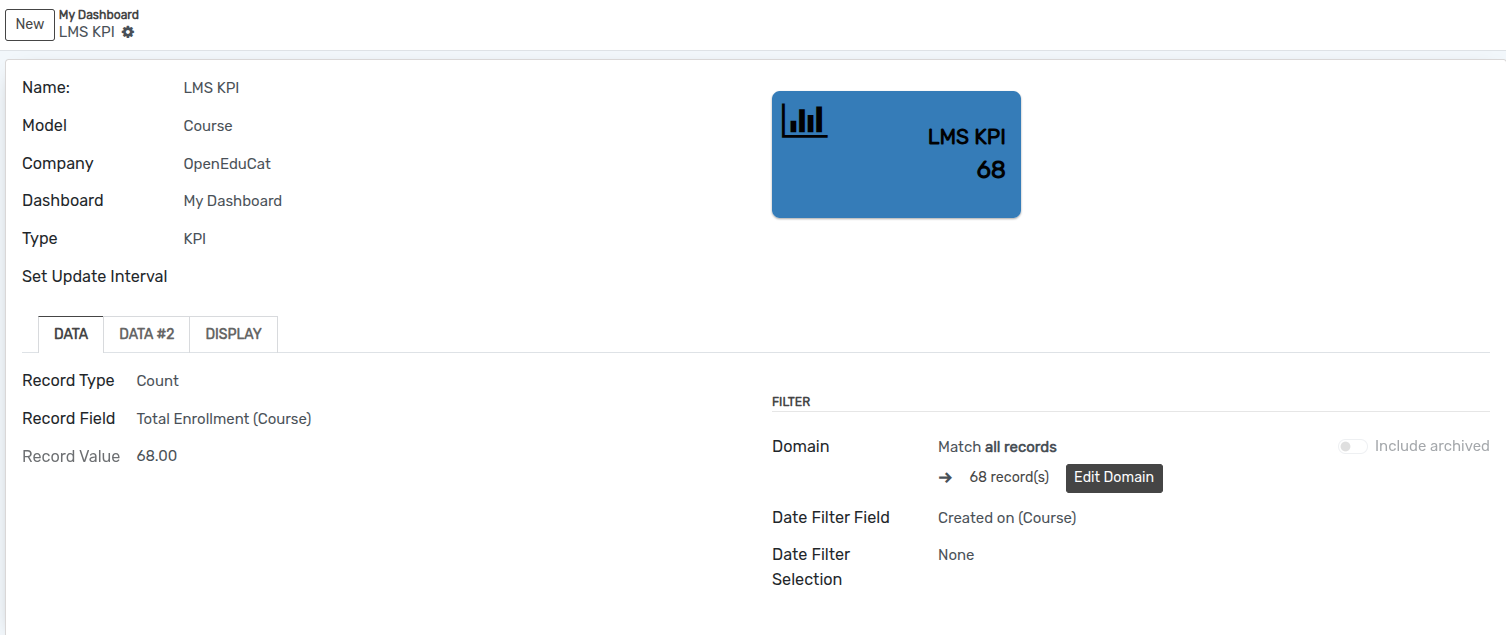
Name :- Specify the name of KPI.
Model :- Select the model from the list.
Company :- Select the Company from the list.
Dashboard :- Select the dashboard from the list.
Set Update Interval :- Set the update interval time in set update interval field.
Pages
Data
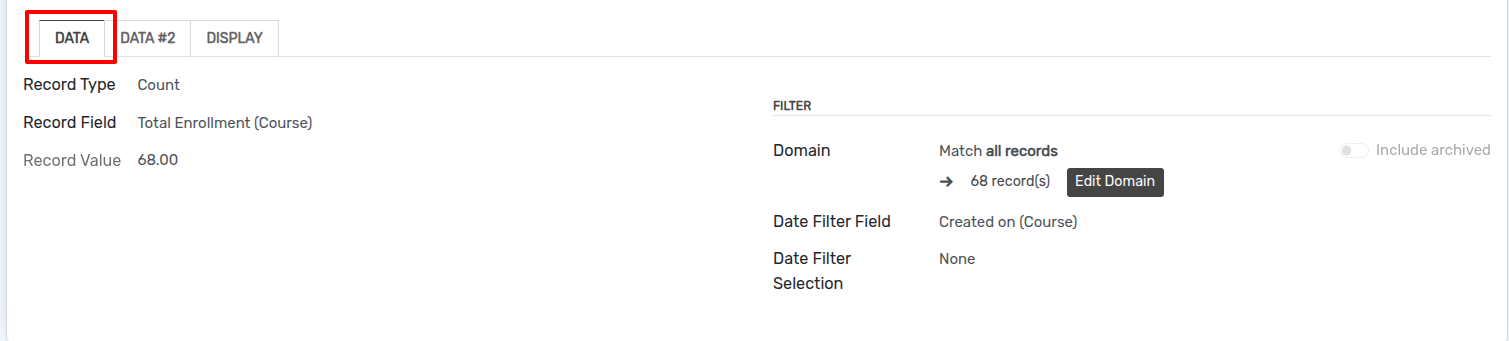
Record Type :- select the record type which is sum, count or avarage from the list.
Record Field :- Select the Record Field based on selected model from the list.
Record Value :- It will automatically add based on selected record field.
Domain :- Add domain for current KPI.
Data 2
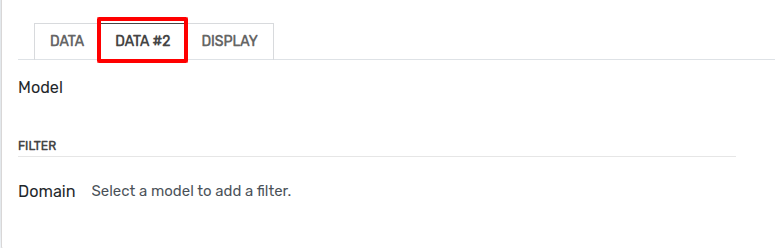
Dashboard Pro Let You Customize Menu Title And It’s Value From Different Models In Data Tab. In KPI View You Can Select Between Progress Bar Or Percent In Target Tab. Also You Can Compare With Another Model in Sum , Ratio And Percentage.
Display
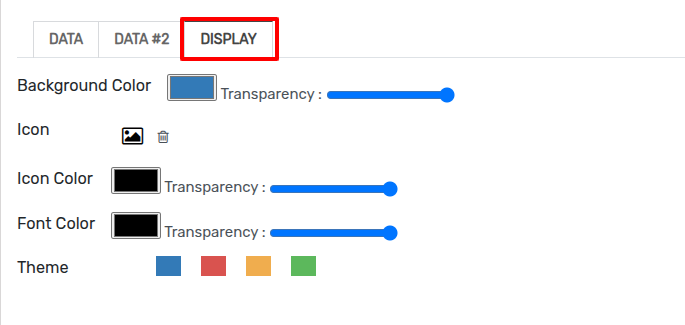
KPI Dashboard provides to select different icon from font awesome and also let you select your favourite color.It also let you select color for font and background from display tab.
How to make Text box
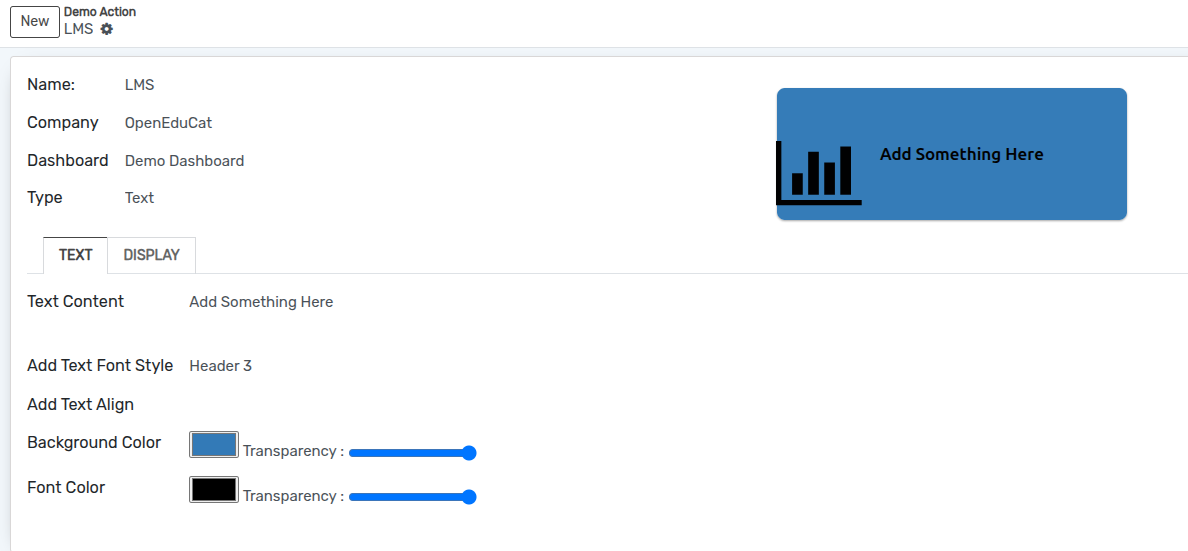
Name :- Specify the name of tile.
Company :- Select the Company from the list.
Dashboard :- Select the dashboard from the list.
Pages
Text
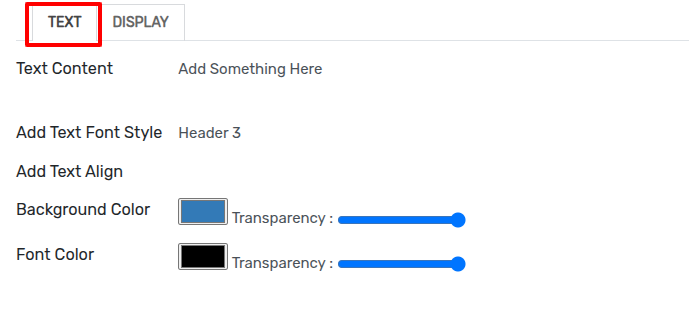
Text Content :- Add a text content of the text box.
Add Text Font Style :- Select the font style for text box from the list.
Add Text Align :- Select the text align from the list.
Also you can set background color and font color for current text box.
Display
KPI Dashboard provides to select different icon from font awesome and also let you select your favourite color.It also let you select color for font and background from display tab.
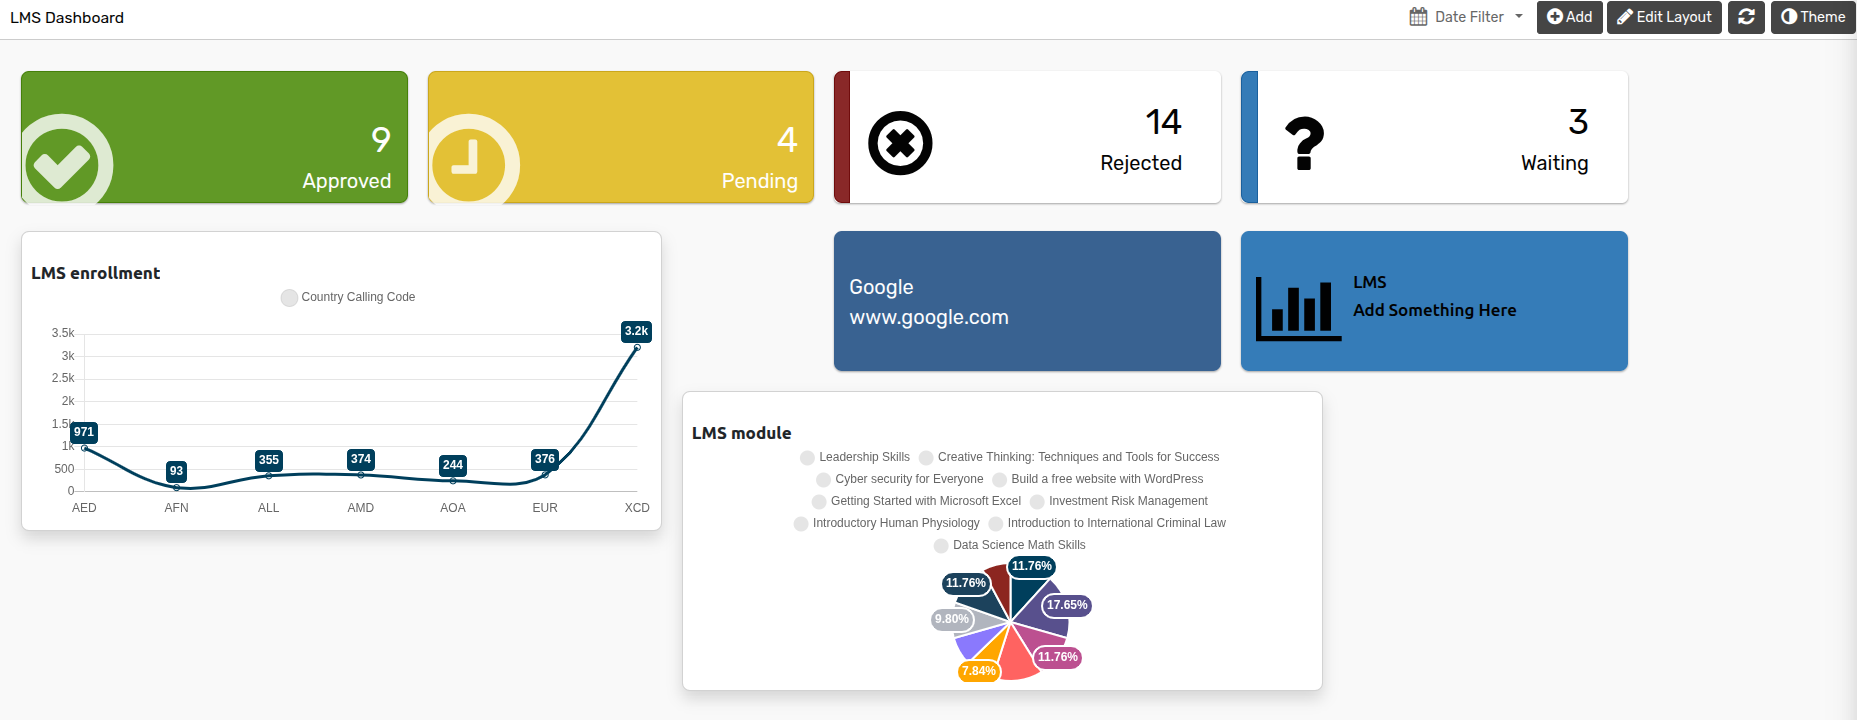
How to add Link
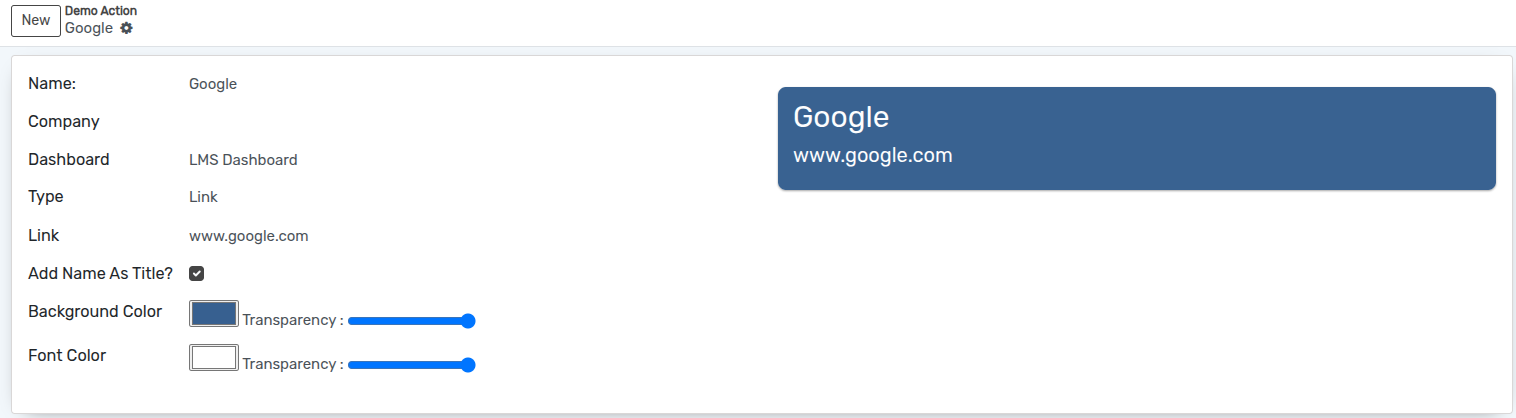
Name :- Specify the name of link.
Company :- Select the Company from the list.
Dashboard :- Select the dashboard from the list.
Link :- Add the link here.
Add Name As Title? :- If you want to use name as title check Add Name As Title checkbox.
Also you can set background color and font color for current link box.
How to add Divider
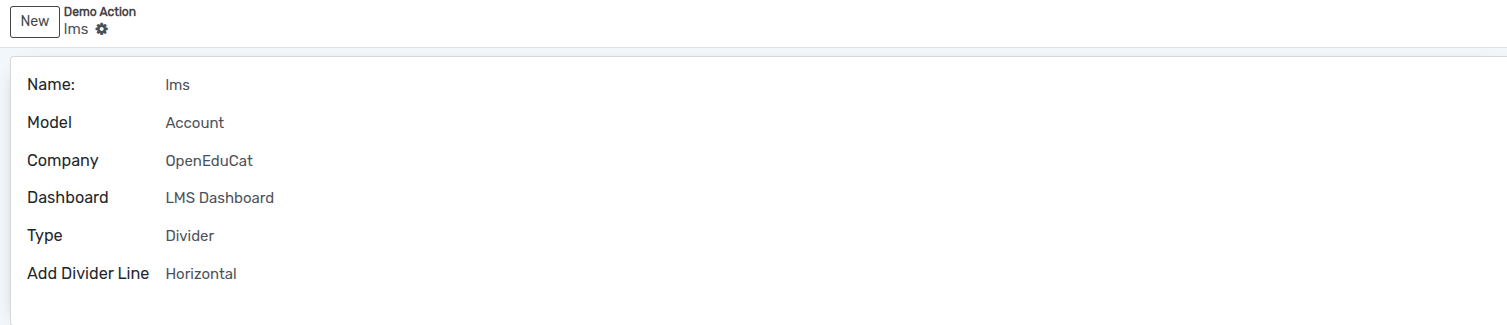
Name :- Specify the name of Divider.
Model :- Select the model from the list.
Company :- Select the Company from the list.
Dashboard :- Select the dashboard from the list.
Add Divider Line :- Select the divider line which is Horizontal or Vertical from the list.
How to add Image
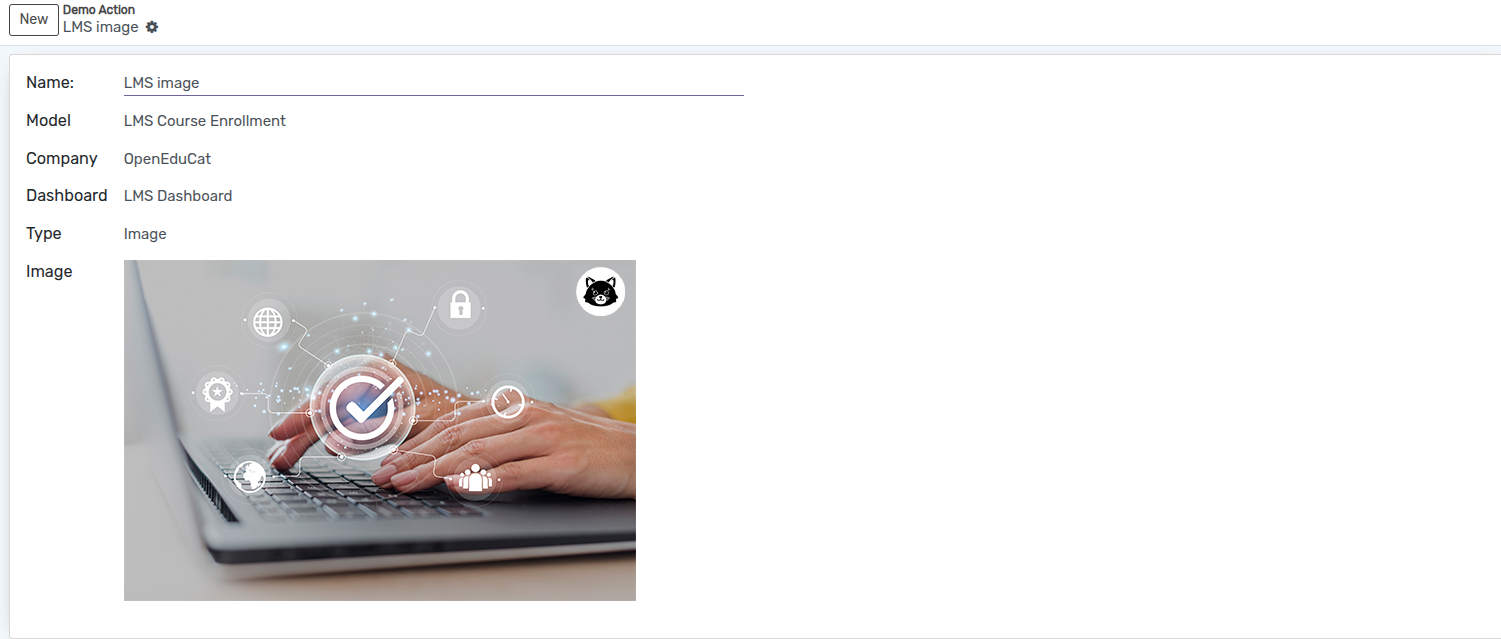
Name :- Specify the name of Image.
Model :- Select the model from the list.
Company :- Select the Company from the list.
Dashboard :- Select the dashboard from the list.
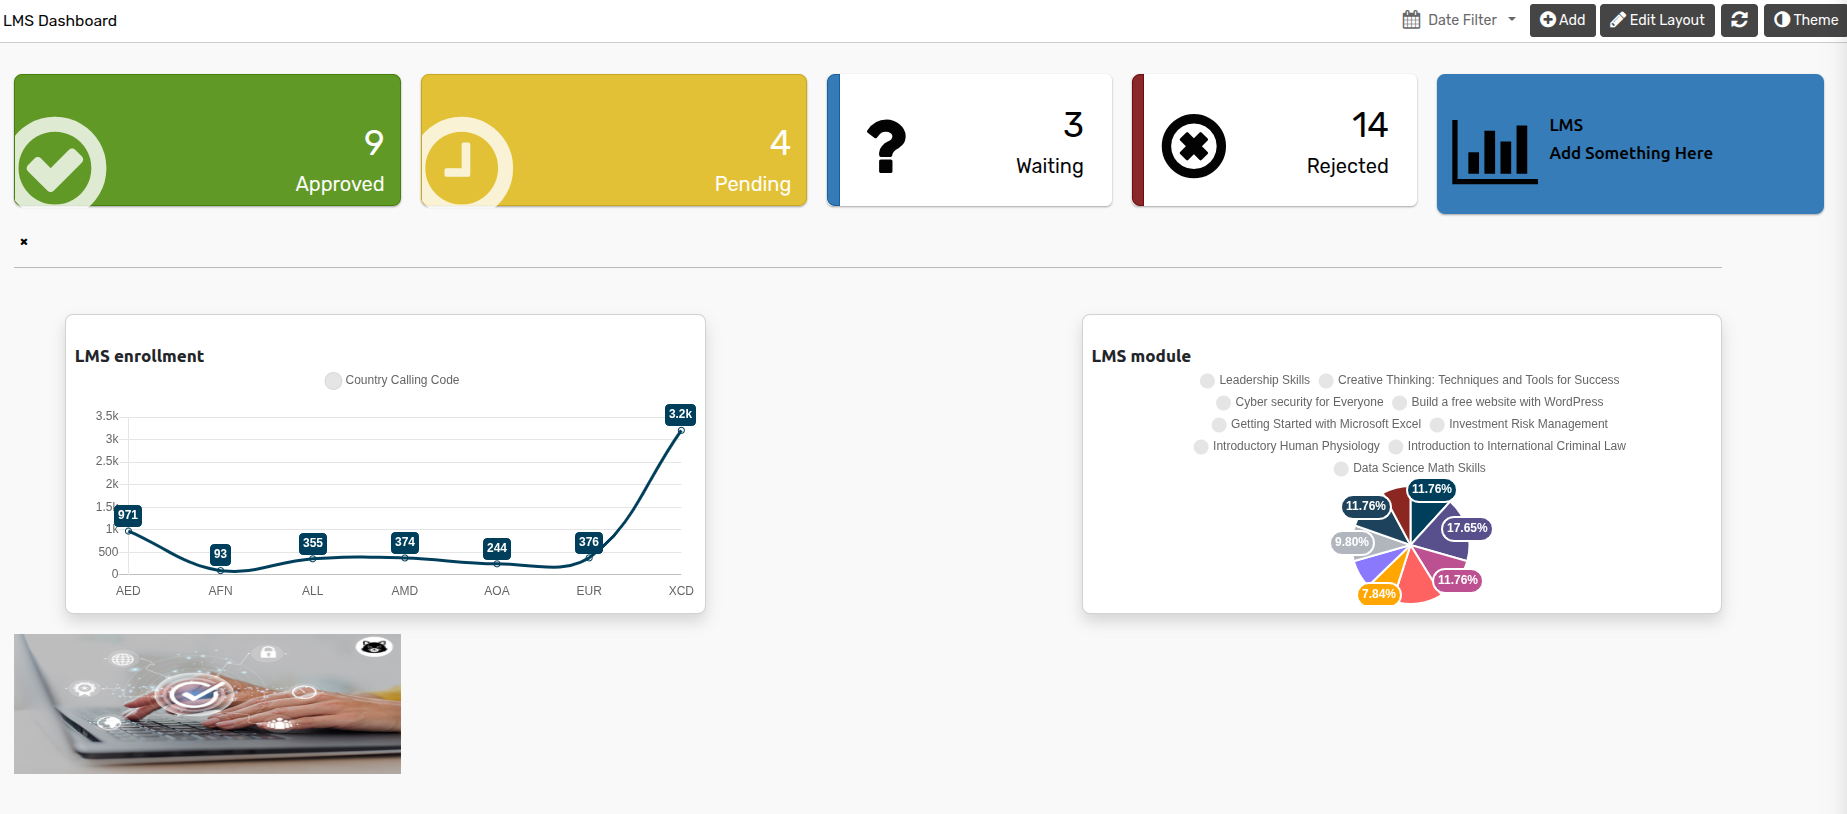
Image :- Add an image which you want to show on dashboard.
How to add List
KPI Dashboard Also Provides List View. Which Let You Add Different Fields In List. KPI Dashboard Also Let You Customize Individual Record From List In Dashboard.
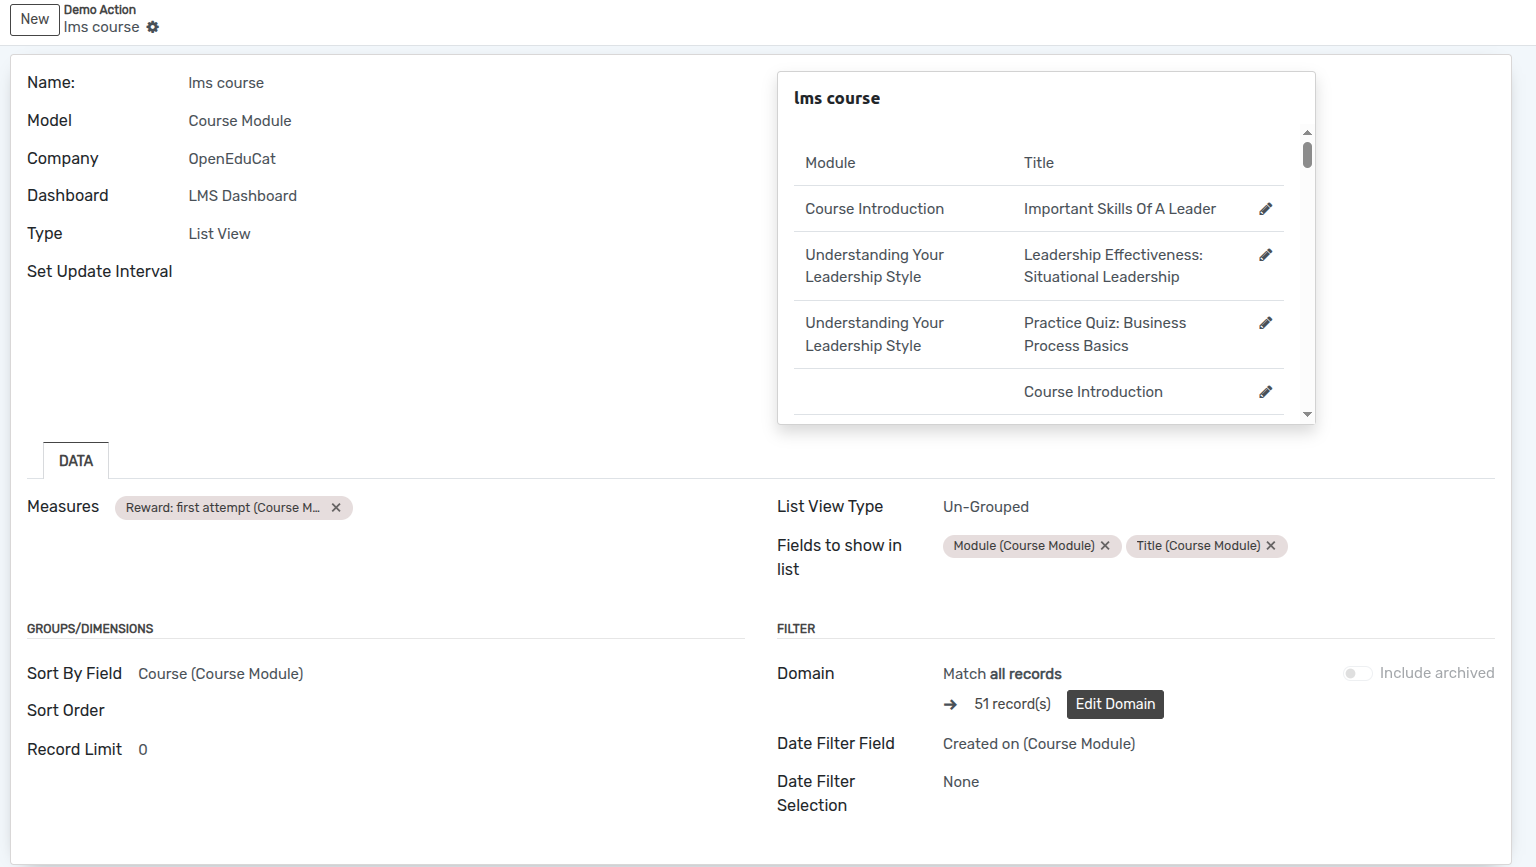
Name :- Specify the name of list.
Model :- Select the model from the list.
Company :- Select the Company from the list.
Dashboard :- Select the dashboard from the list.
Set Update Interval :- Set the update interval time in set update interval field.
Pages
Data
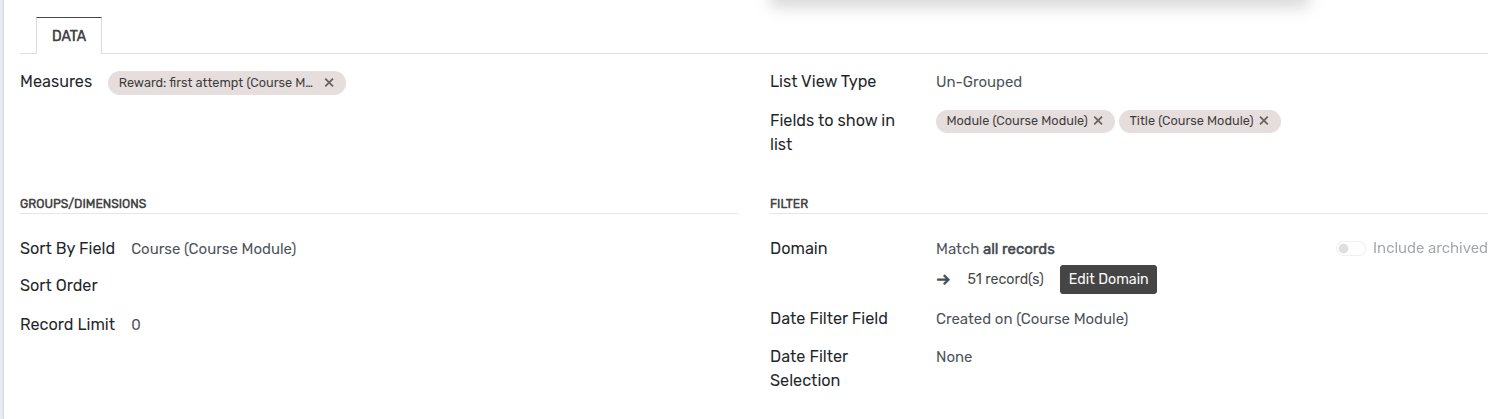
List View Type :- Select the list view type which id grouped or Un-grouped from the list.
Fields to show in list :- Select the fields which are you want to show in list.
Sort By Field :- Select the sort by field from the list.
Sort Order :- Select the sort order which is Ascending or Descending.
Record Limit :- Add the record limit as you want to display.
Domain :- Add domain for current list.
How to add To-do list
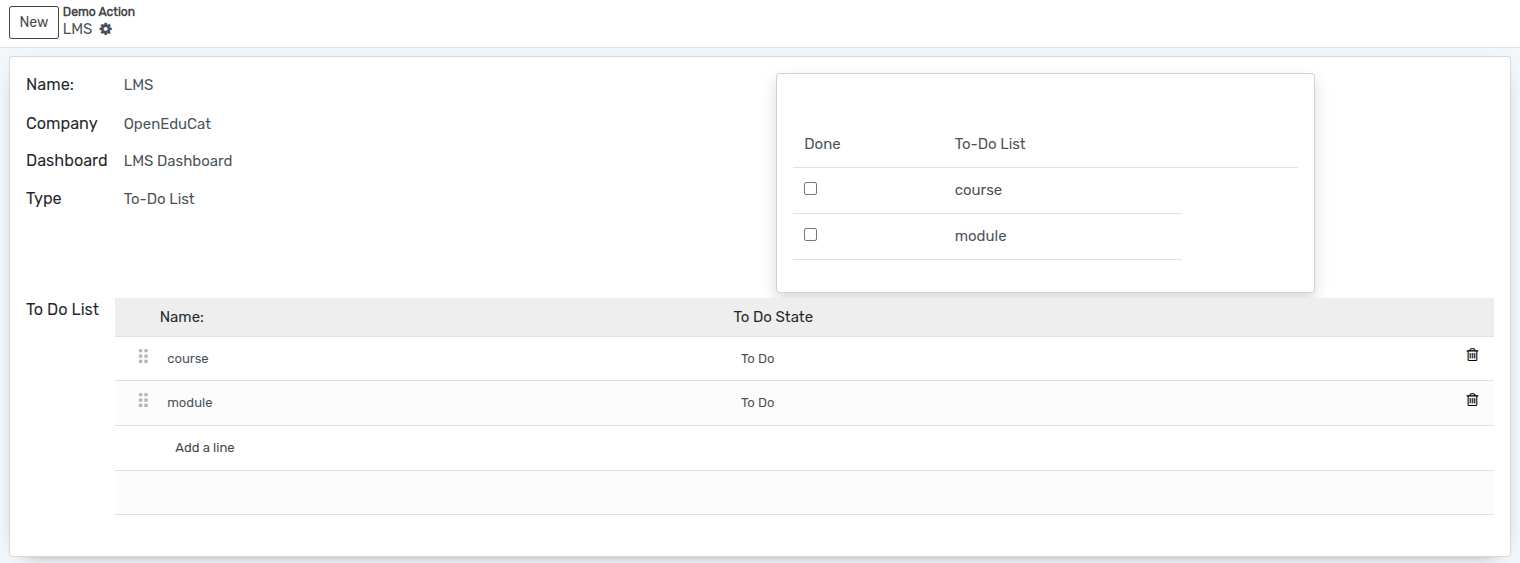
Name :- Specify the name of To-do list.
Company :- Select the Company from the list.
Dashboard :- Select the dashboard from the list.
How to Import/Export element
You Can Export Chart As Excel, Csv, PDF, Image And Json. Json File Can Be Imported In Dashboard Later.
Export
Import