
Timetable Planning
The openeducat_timetable_planning module adds a Gantt view to the
sessions of the timetable. It gives the person who builds the timetable a
single picture of the load of every faculty member over a day, a week or a
month, so that free slots and overloaded faculties can be seen at a glance.
Install the openeducat_timetable_planning module from the apps. It brings
in the Web Gantt and the OpenEduCat Timetable Enterprise modules.
The module does not add any menu of its own. It adds the Gantt view to the views which already show the sessions :-
.
The session lists which are opened from the timetable dashboards.
Open the Gantt View
Go to . The Gantt view is the last icon of the view switcher, on the top right corner of the screen.
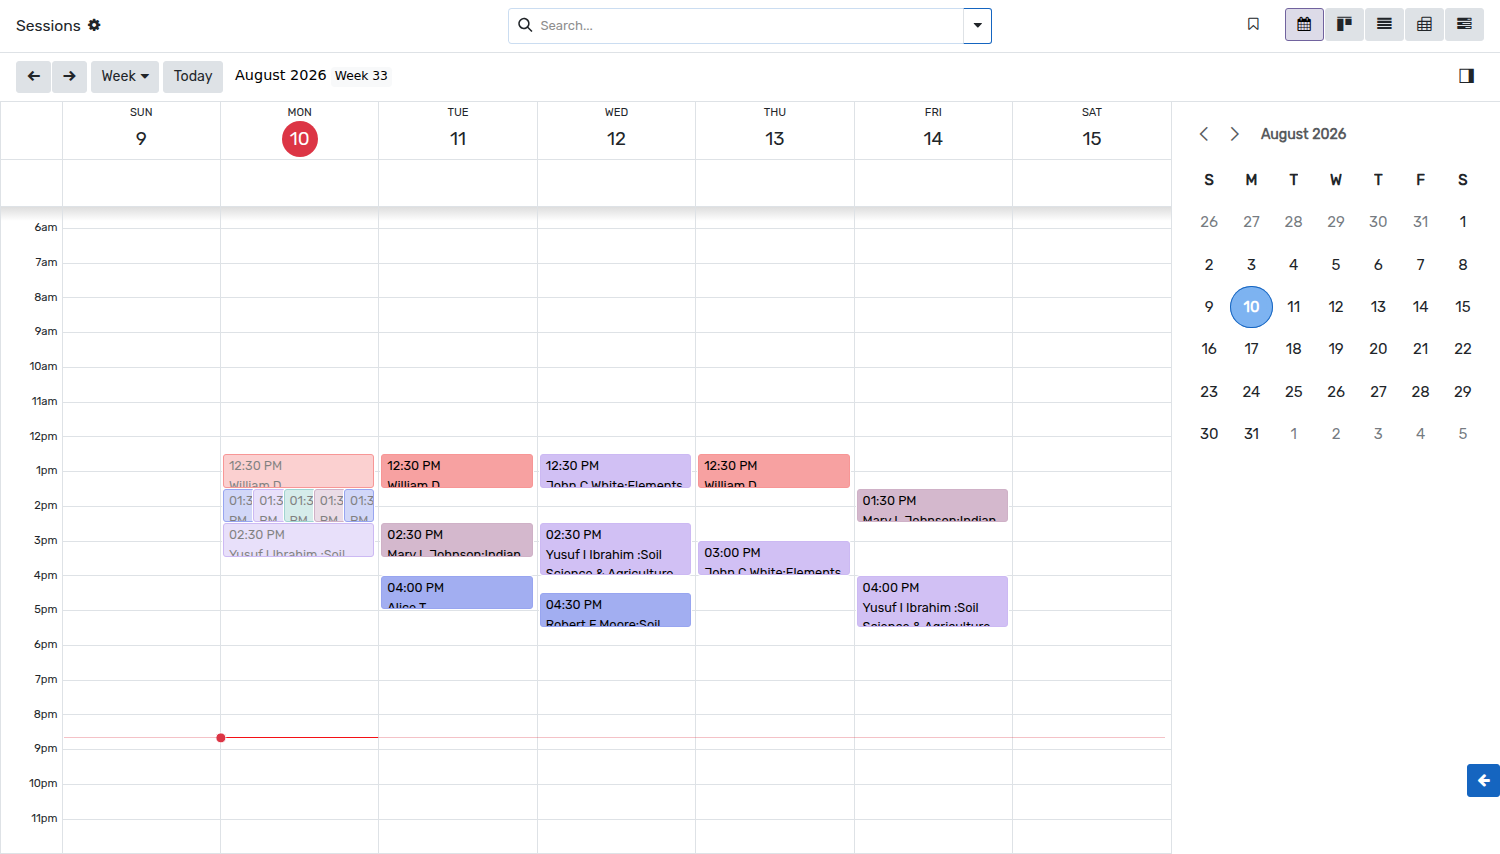
Click on it to switch from the calendar, the kanban, the list or the pivot to the planning.
Details of the Gantt View
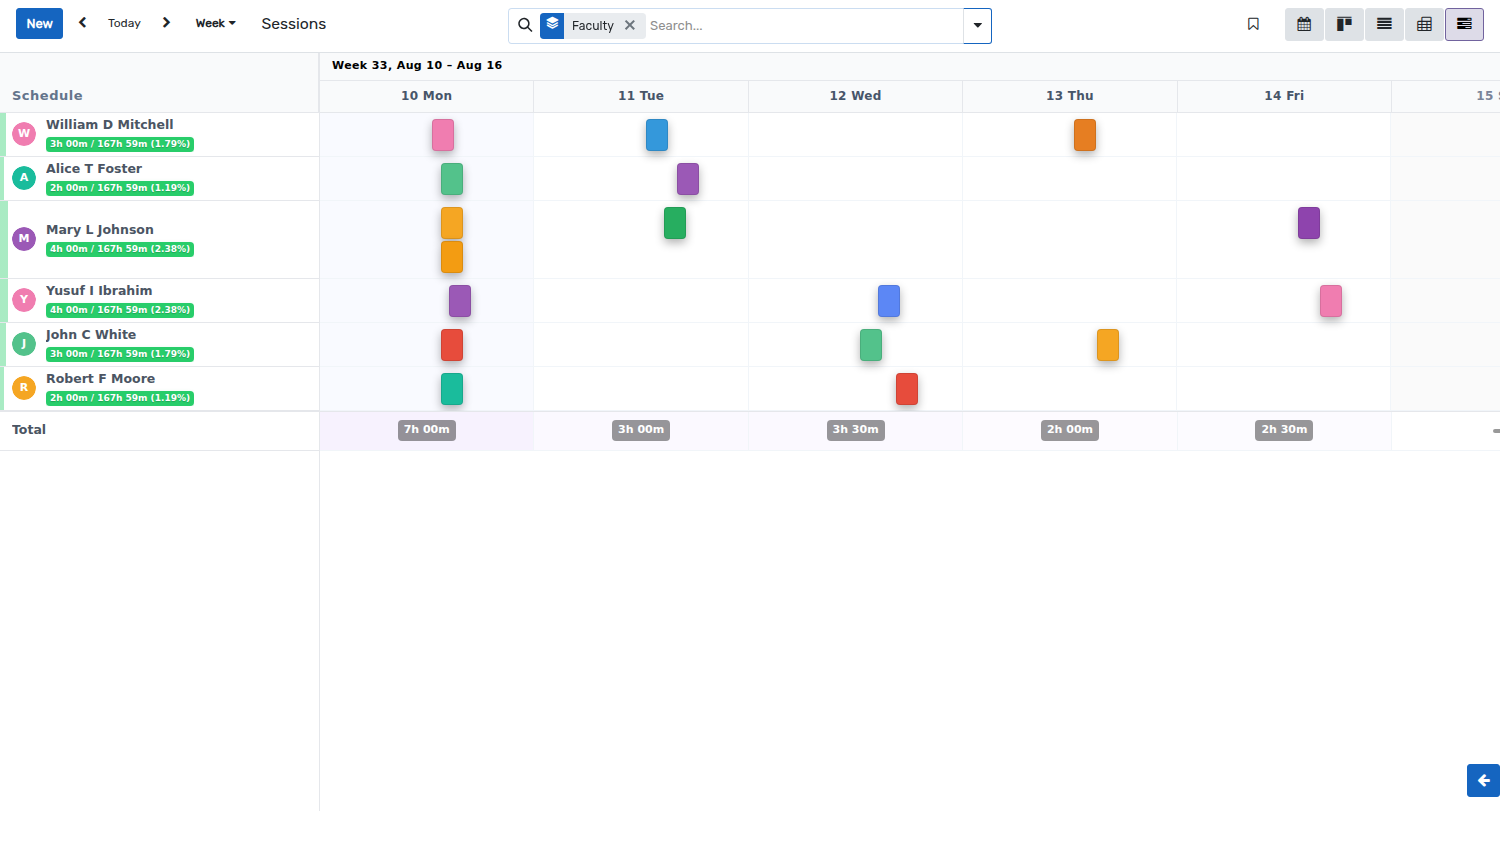
Schedule :- The sessions are grouped by faculty. Every row carries the photo and the name of a faculty member, so that the planning is read as one line per teacher.
Workload :- Below the name of every faculty member, the badge shows the time which is booked for that faculty over the displayed period, compared with the length of the period, together with the percentage it represents.
Sessions :- Every session is drawn as a coloured block, placed at its start time and as long as its duration. The colour comes from the faculty member, so the sessions of one teacher keep the same colour everywhere.
Total :- The line at the bottom of the planning adds up the booked time of all the faculties for every column, which shows the busy days of the institute.
Today :- The
Todaybutton and the two arrows on the top left move the planning to the current period, to the previous one or to the next one.
The Faculty grouping is applied by default. Use the Group By menu of the
search bar to build the planning around another field, for example the classroom
or the batch, and the Filters to restrict it to a course or a period.
Scales of the Planning
The scale selector on the top left of the planning switches between three levels of detail.
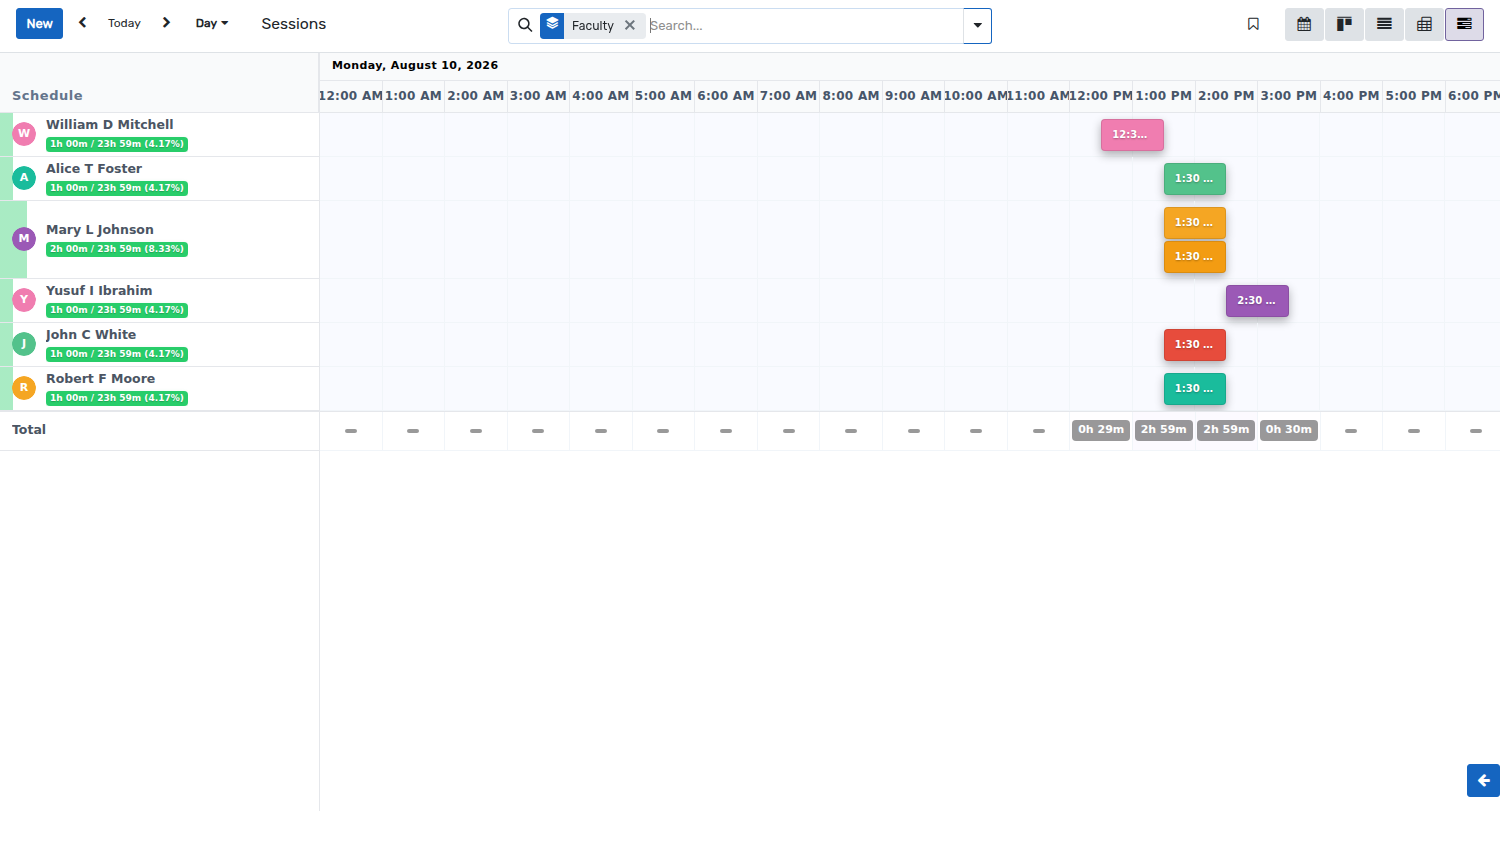
Day
The day scale spreads the day over its hours, so the exact time of every session and the gaps between two sessions of the same faculty are visible.
Week
The week scale shows one column per day of the week. It is the scale which is used to build a timetable, as a whole week of the institute is seen at once.
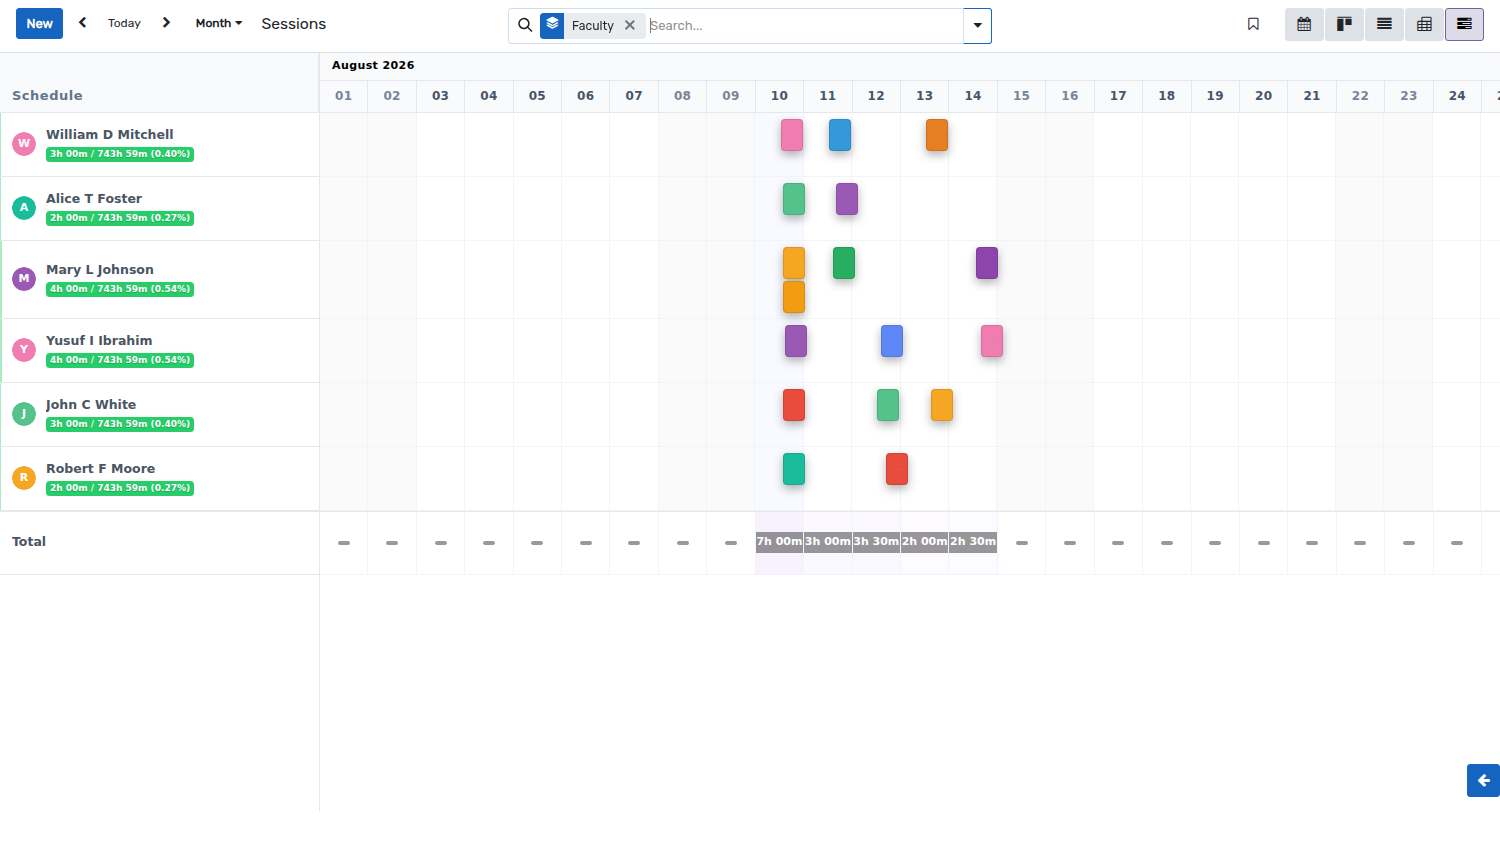
Month
The month scale shows one column per day of the month, which gives the load of every faculty member over a longer period.
Nota
The planning reads the Start Time and the End Time of the sessions, so a session is only drawn once both are filled in. Sessions are created and modified as usual, from the session form or from the Generar sesiones wizard — the Gantt is a way of looking at them, it does not change how they are recorded.