Comment ..
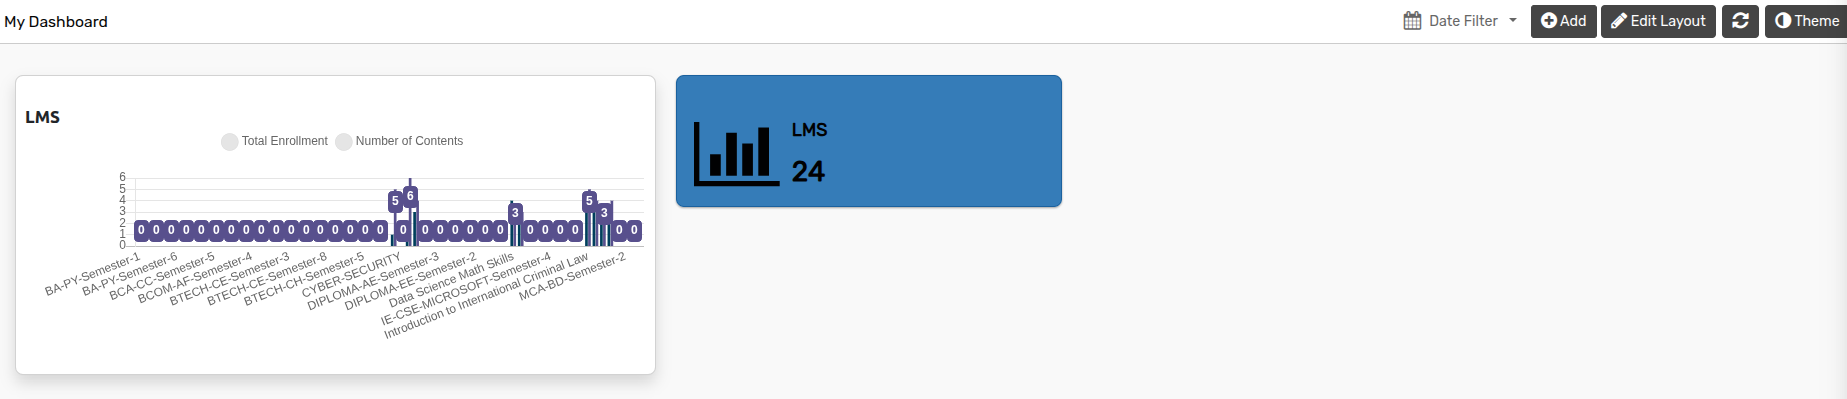
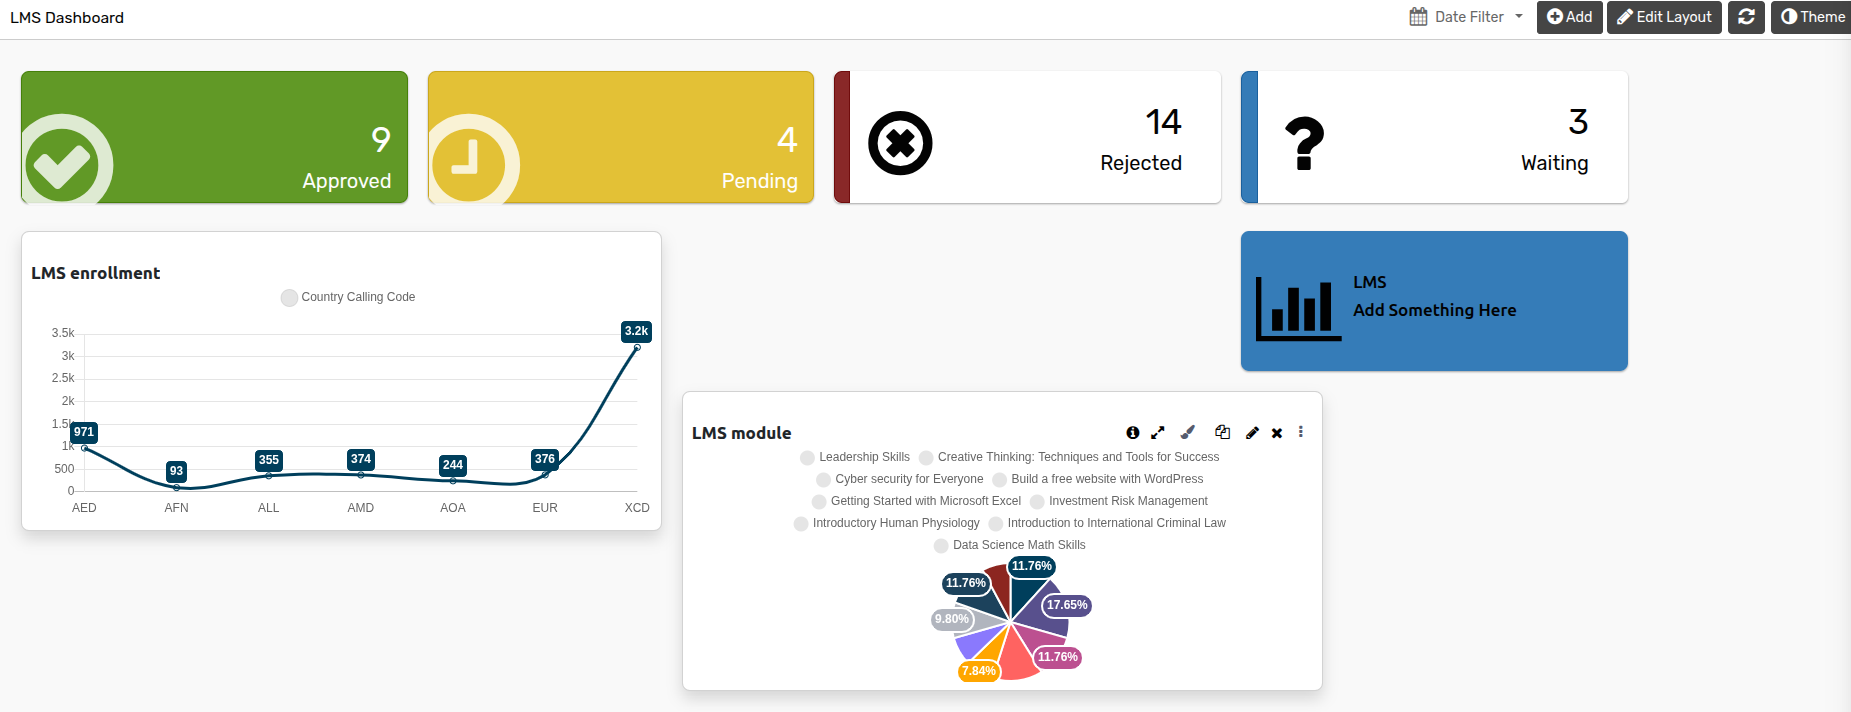
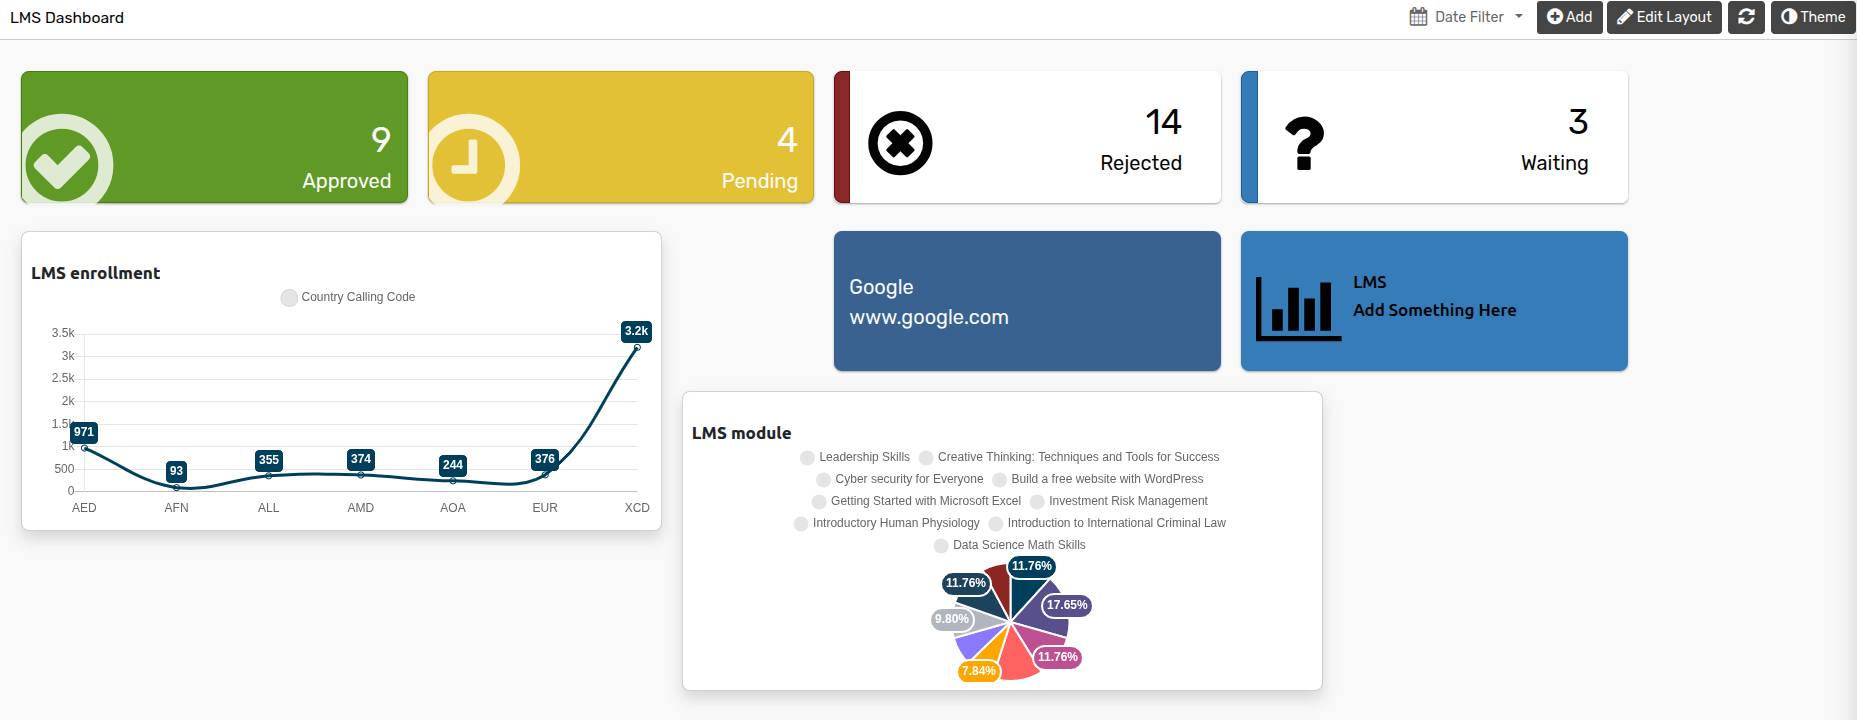
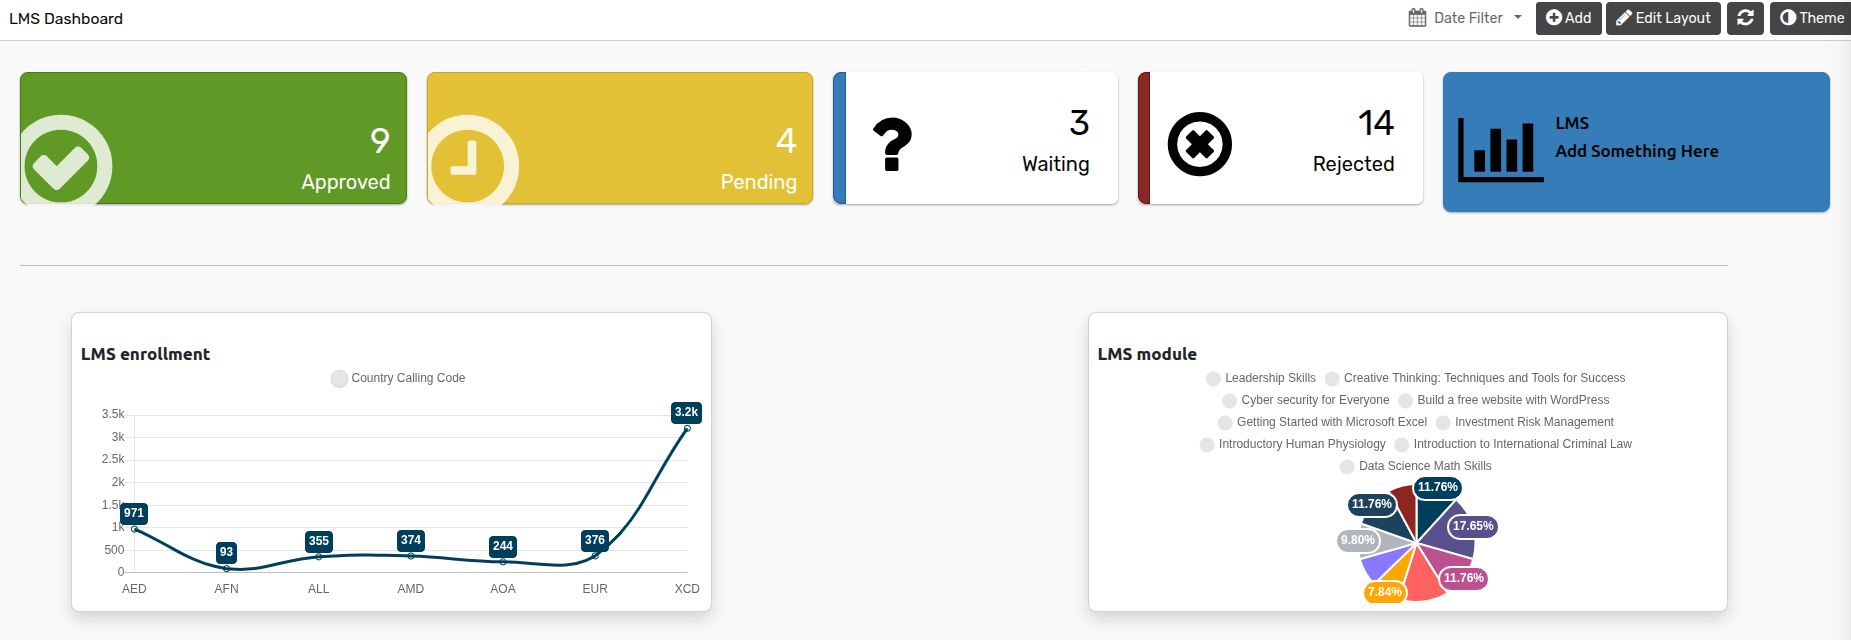
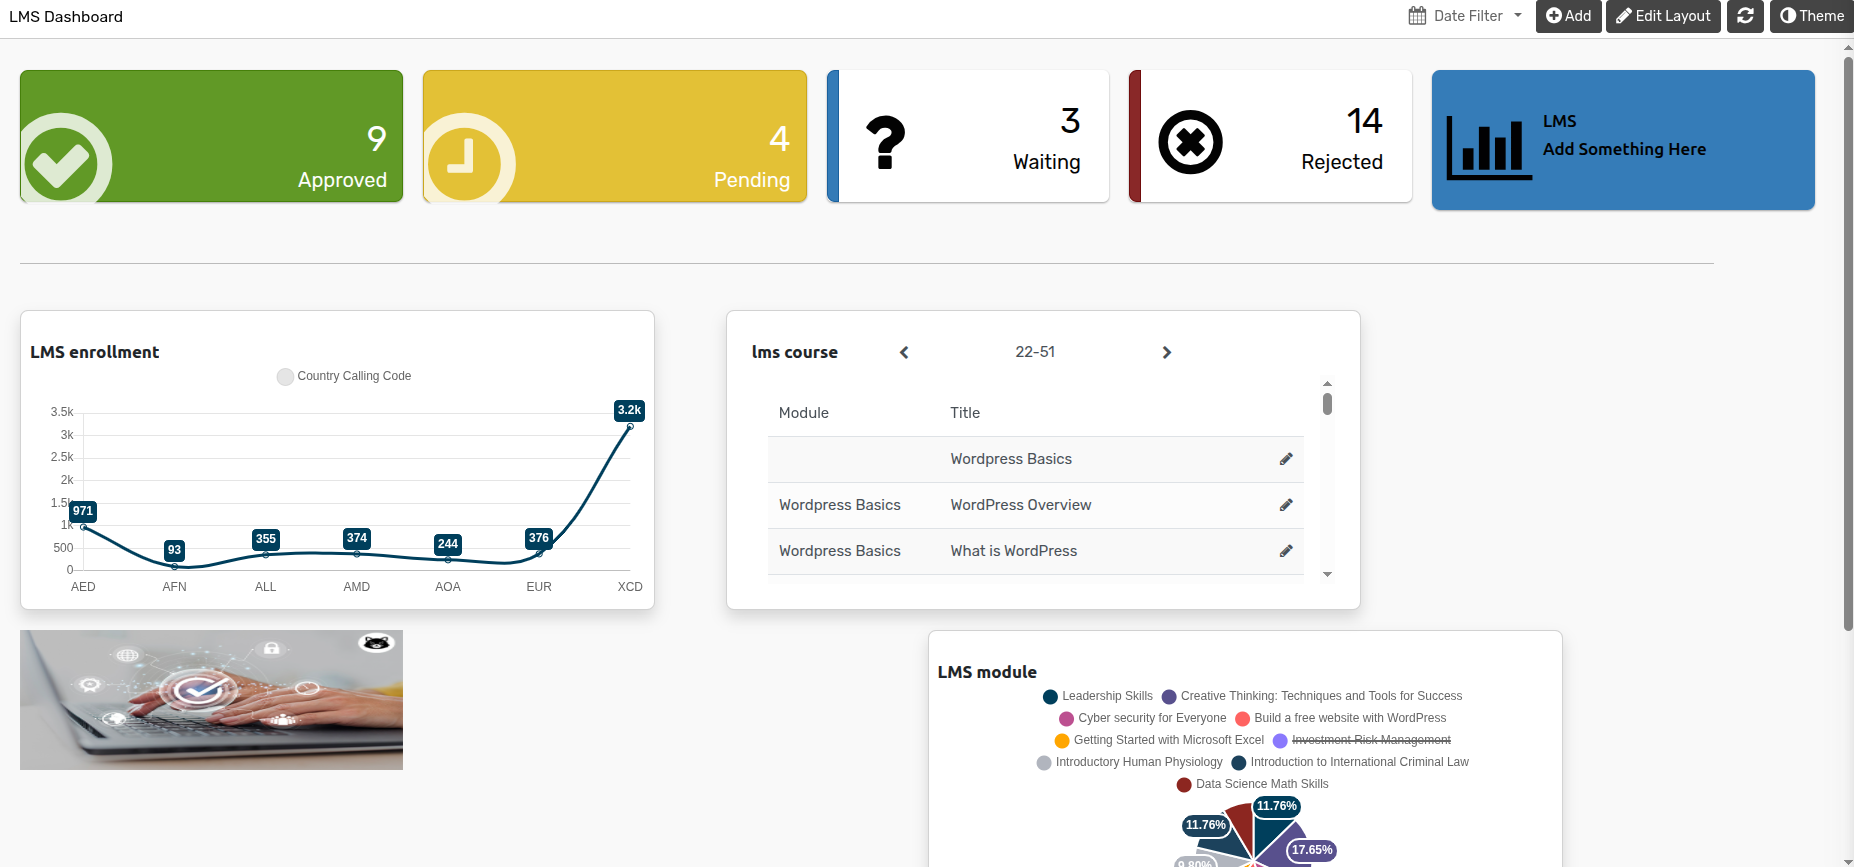
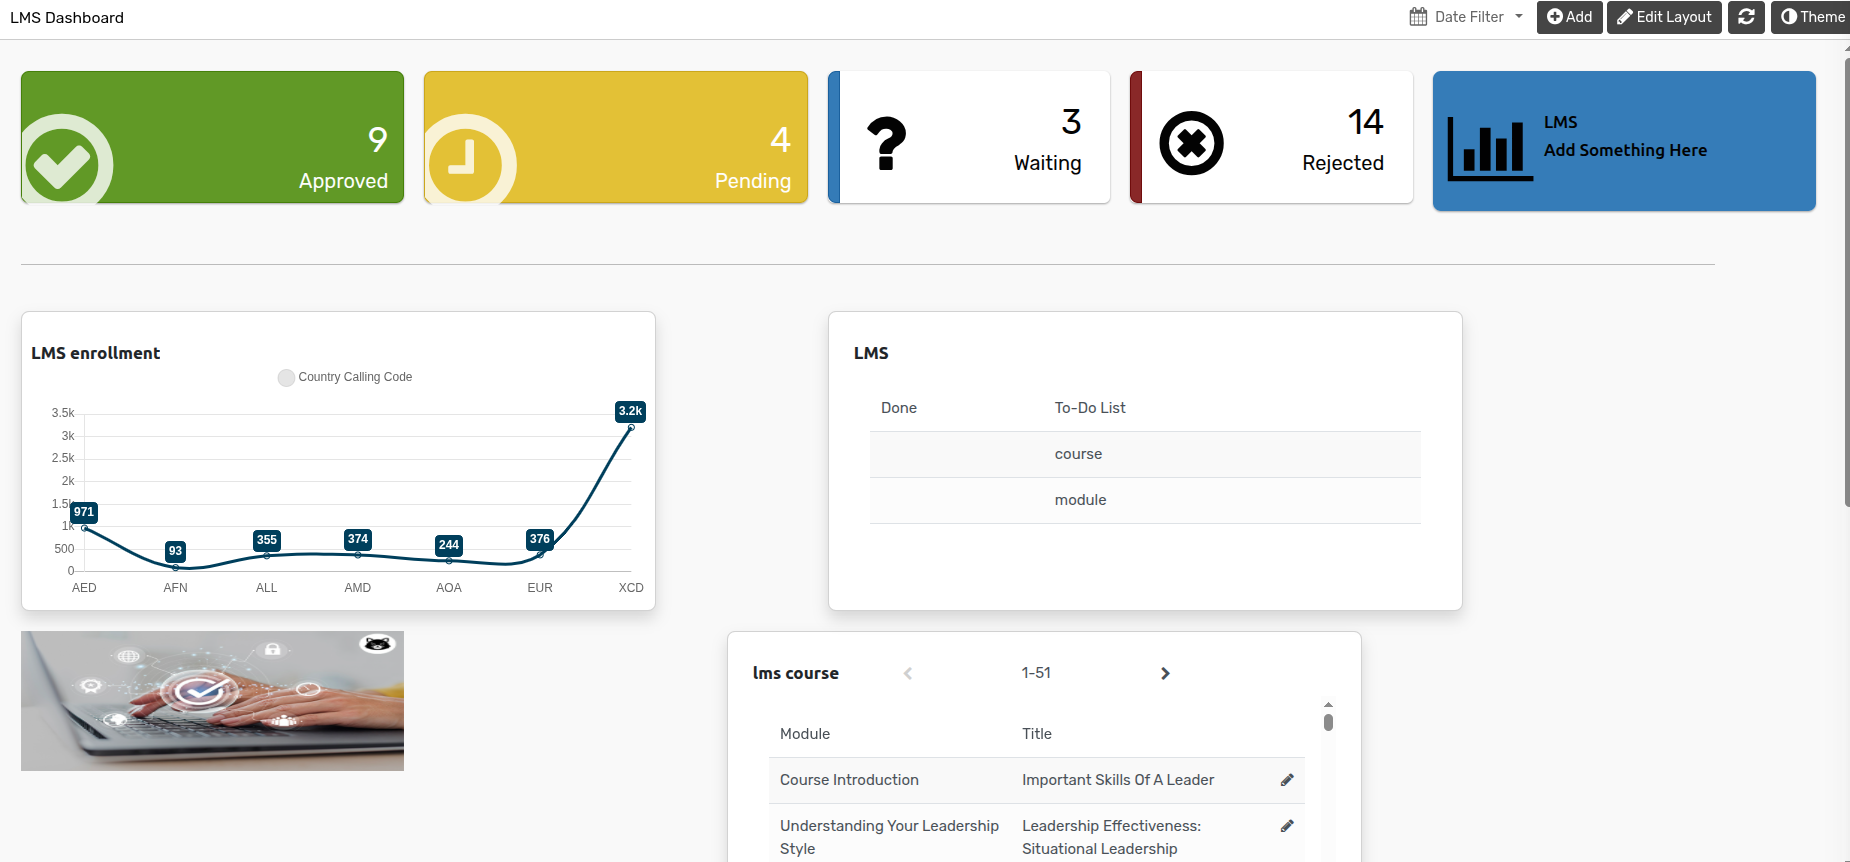
Le tableau de bord KPI vous aide à surveiller facilement vos données importantes. Il contient plusieurs vues en mosaïque, une vue Kpi, une vue Liste et plusieurs vues Graphiques.
Comment créer des graphiques
You can go to the .
Click on Add button to add charts.
Dashboard Pro fournit plusieurs types de graphiques tels que des barres, des barres horizontales, des lignes, des aires, des secteurs, des beignets et des zones polaires.
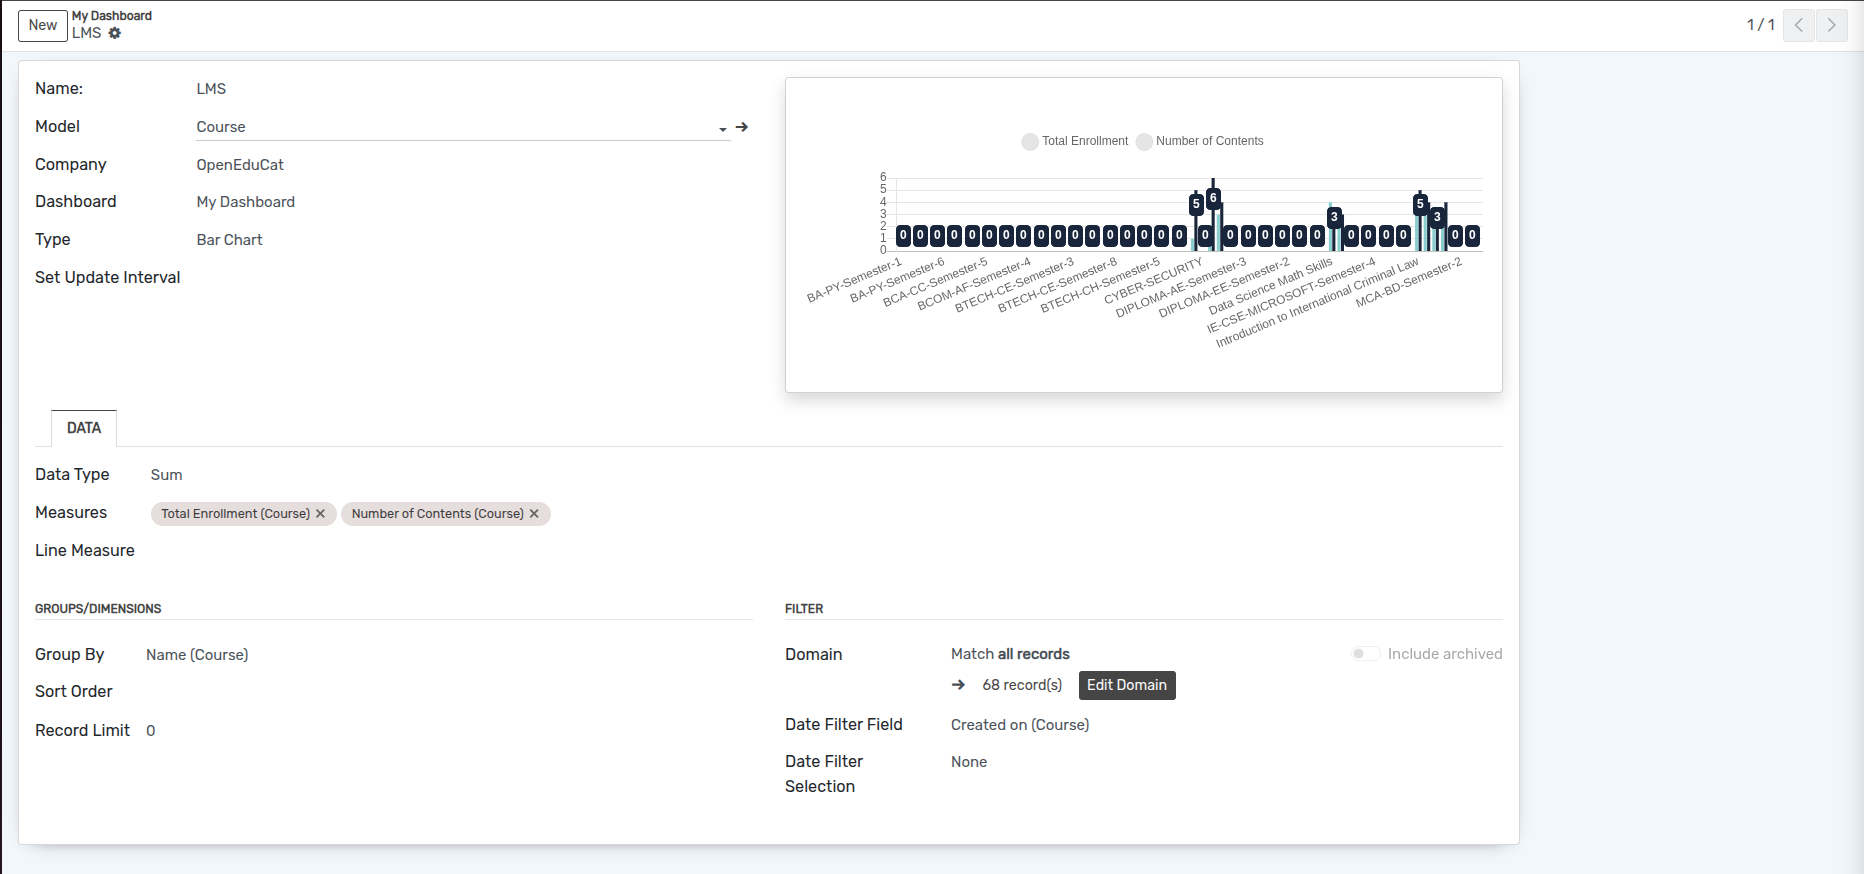
Name :- Specify the name of chart.
Model :- Select the model from the list.
Company :- Select the Company from the list.
Dashboard :- Select the dashboard from the list.
Type :- Select the type of chart from the list.
Set Update Interval :- Set the update interval time in set update interval field.
Pages
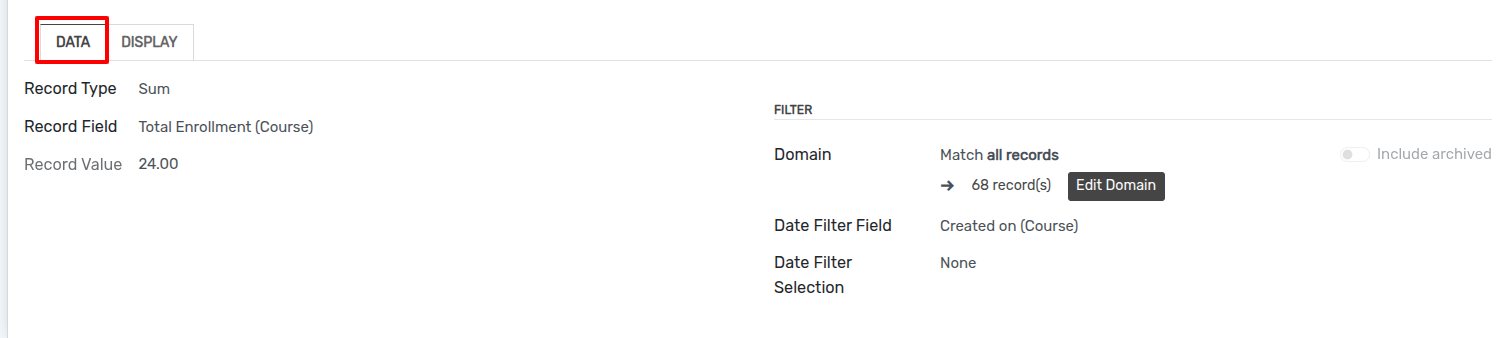
Données
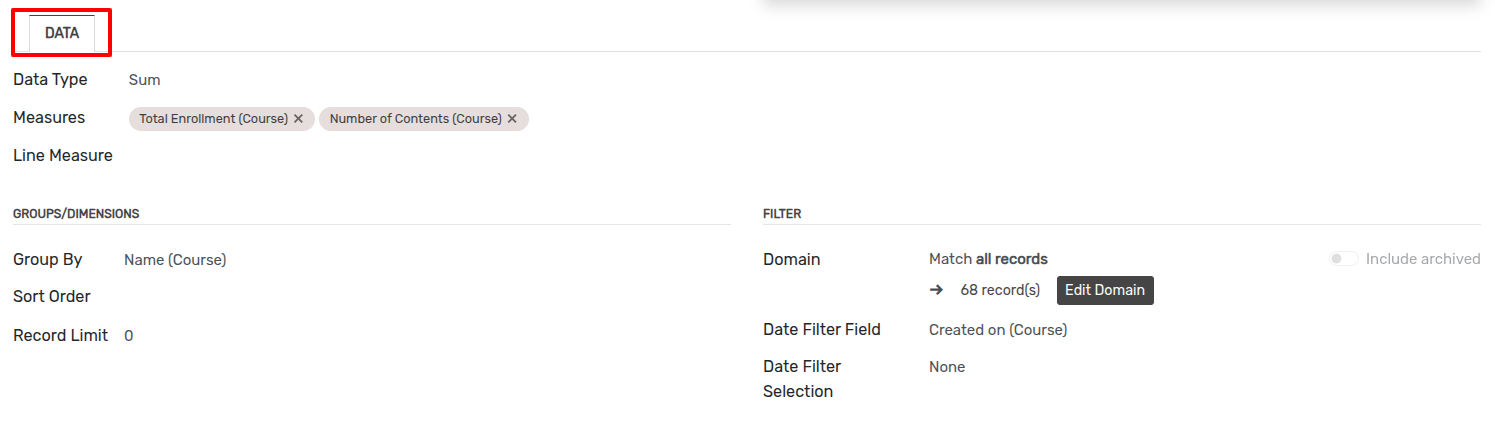
Data type :- select the data type which is sum, count or avarage from the list.
Measures :- Select the Measures of the selected model from the list.
Line Measure :- Select the Line Measures of the selected model from the list.
Group By :- Select the group by which you want to group from the list.
Sort By Field :- Select the sort by field from the list.
Sort Order :- Select the sort order which is Ascending or Descending.
Record Limit :- Add the record limit as you want to display.
Domain :- Add domain for current chart.
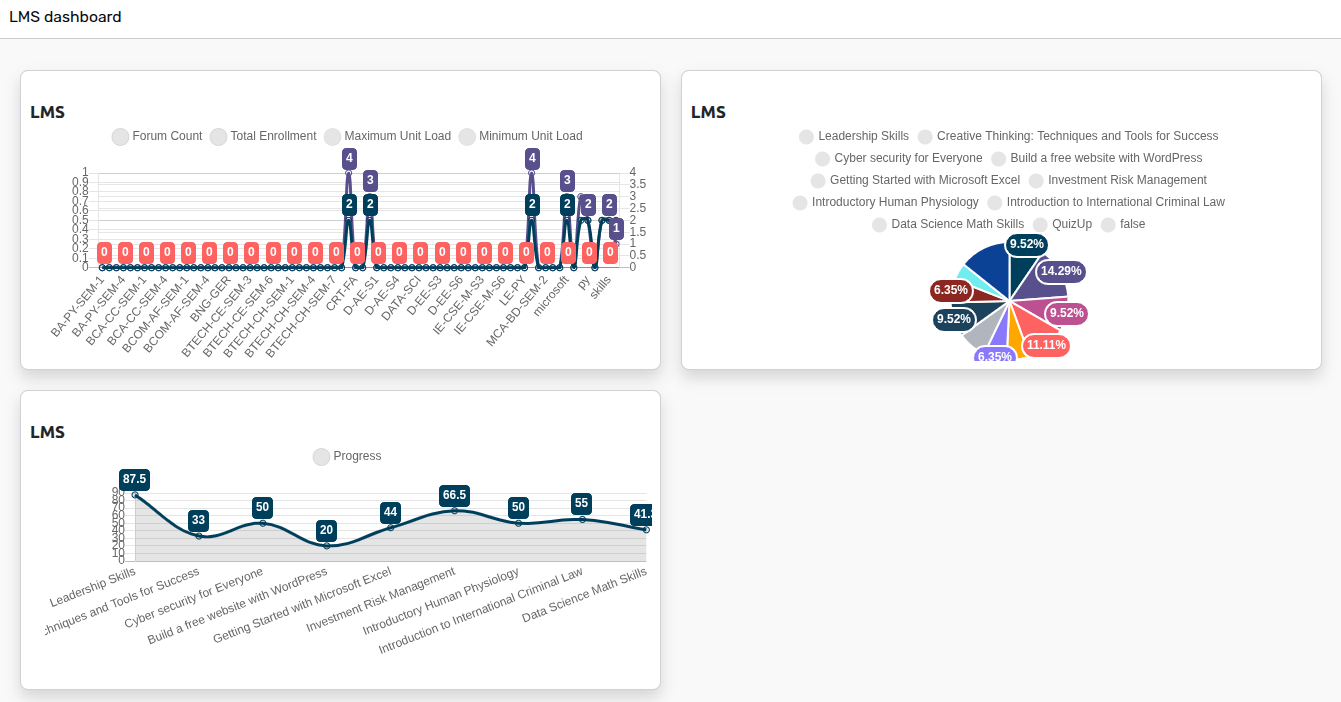
De cette façon, vous pouvez créer plusieurs graphiques avec différents types.
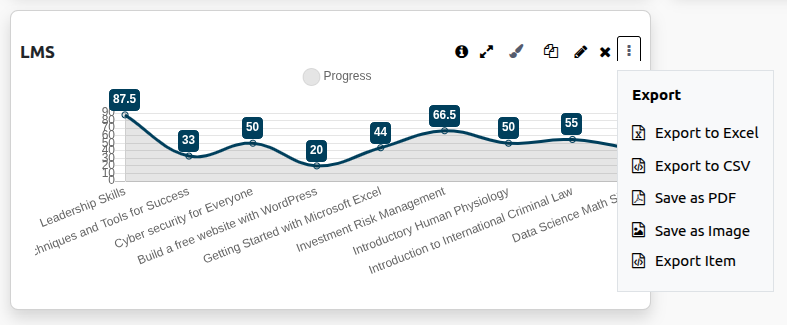
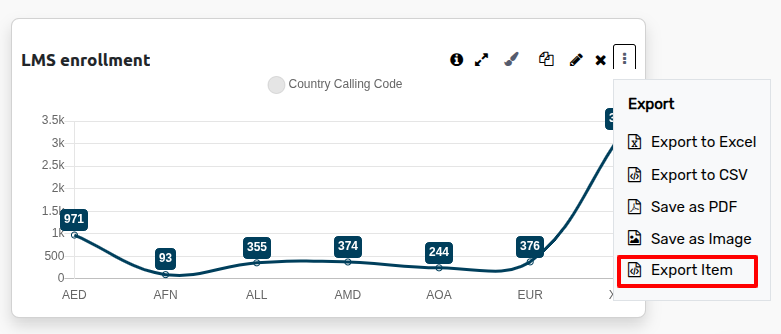
Vous pouvez exporter le graphique au format Excel, Csv, PDF, image et Json. Le fichier Json peut être importé ultérieurement dans le tableau de bord.
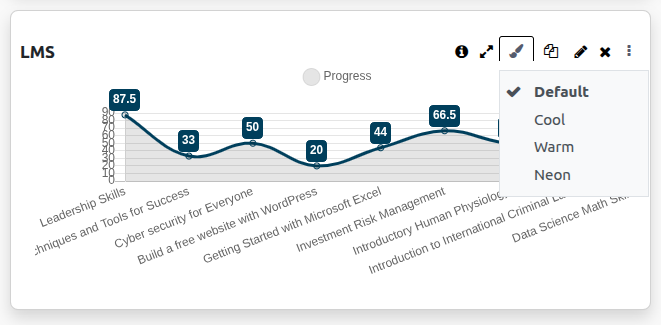
Le tableau de bord KPI propose 4 options de coloration différentes.
Comment faire des tuiles
Le tableau de bord KPI fournit différents éléments tels que la vue en mosaïque et la vue KPI. Il existe 6 superbes et belles dispositions de tuiles.
Name :- Specify the name of tile.
Model :- Select the model from the list.
Company :- Select the Company from the list.
Dashboard :- Select the dashboard from the list.
Pages
Données
Le tableau de bord KPI vous permet de personnaliser le titre du menu et sa valeur à partir de différents modèles dans l’onglet Données. Dans la vue KPI, vous pouvez choisir entre la barre de progression ou le pourcentage dans l’onglet Cible. Vous pouvez également comparer avec un autre modèle en somme, en ratio et en pourcentage.
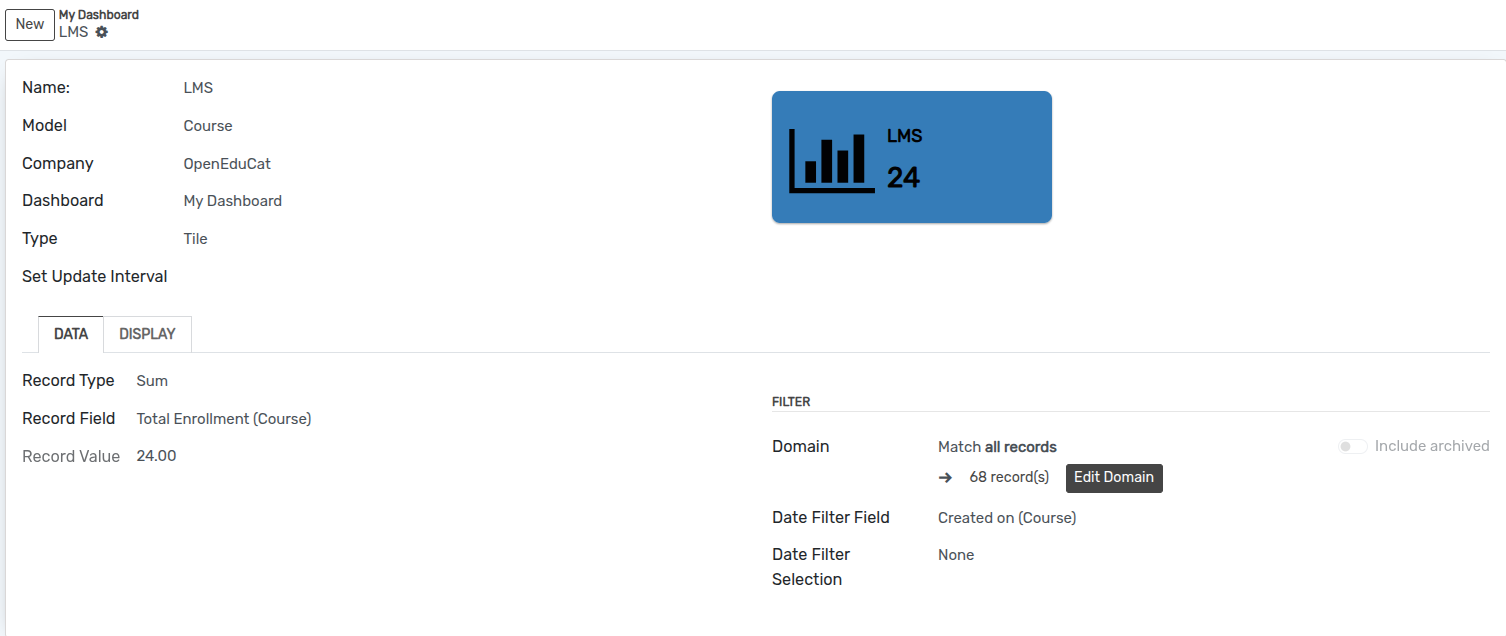
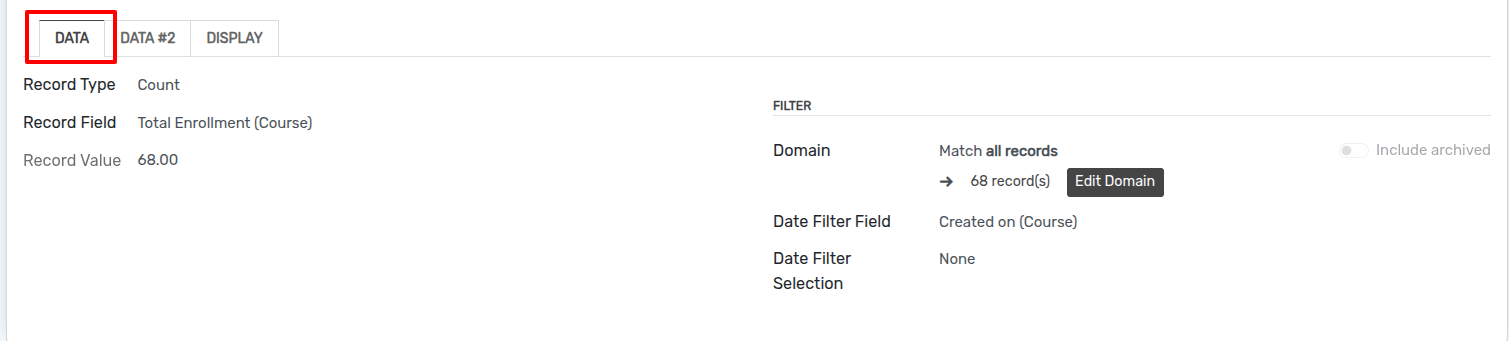
Record Type :- select the data type which is sum, count or avarage from the list.
Record Field :- Select the Record Field based on selected model from the list.
Record Value :- It will automatically add based on selected record field.
Domain :- Add domain for current tile.
Afficher
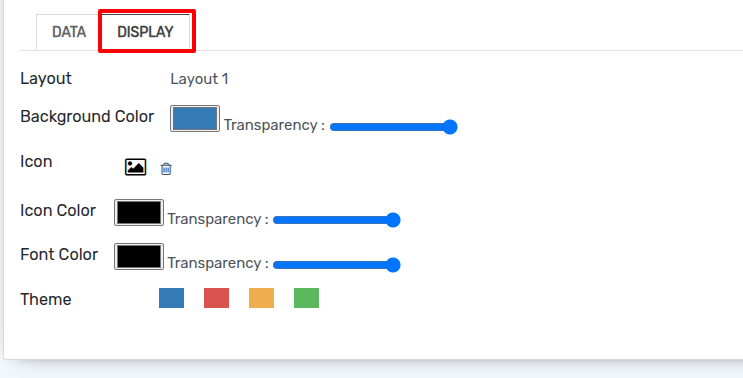
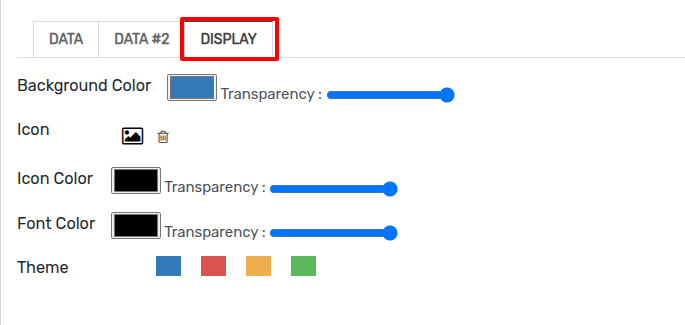
Le tableau de bord KPI permet de sélectionner différentes icônes de la police géniale et vous permet également de sélectionner votre couleur préférée. Il vous permet également de sélectionner la couleur de la police et de l’arrière-plan dans l’onglet d’affichage.
Comment créer des KPI
Name :- Specify the name of KPI.
Model :- Select the model from the list.
Company :- Select the Company from the list.
Dashboard :- Select the dashboard from the list.
Set Update Interval :- Set the update interval time in set update interval field.
Pages
Données
Record Type :- select the record type which is sum, count or avarage from the list.
Record Field :- Select the Record Field based on selected model from the list.
Record Value :- It will automatically add based on selected record field.
Domain :- Add domain for current KPI.
Données 2
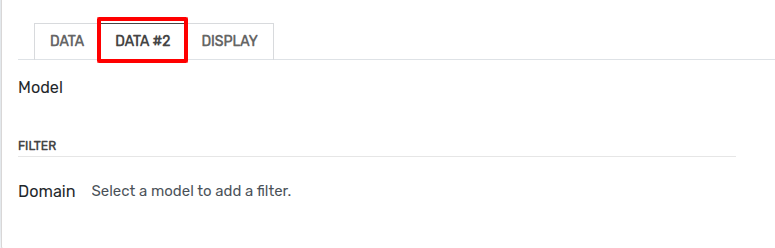
Dashboard Pro vous permet de personnaliser le titre du menu et sa valeur à partir de différents modèles dans l’onglet Données. Dans la vue KPI, vous pouvez choisir entre la barre de progression ou le pourcentage dans l’onglet Cible. Vous pouvez également comparer avec un autre modèle en somme, en ratio et en pourcentage.
Afficher
Le tableau de bord KPI permet de sélectionner différentes icônes de la police géniale et vous permet également de sélectionner votre couleur préférée. Il vous permet également de sélectionner la couleur de la police et de l’arrière-plan dans l’onglet d’affichage.
Comment créer une zone de texte
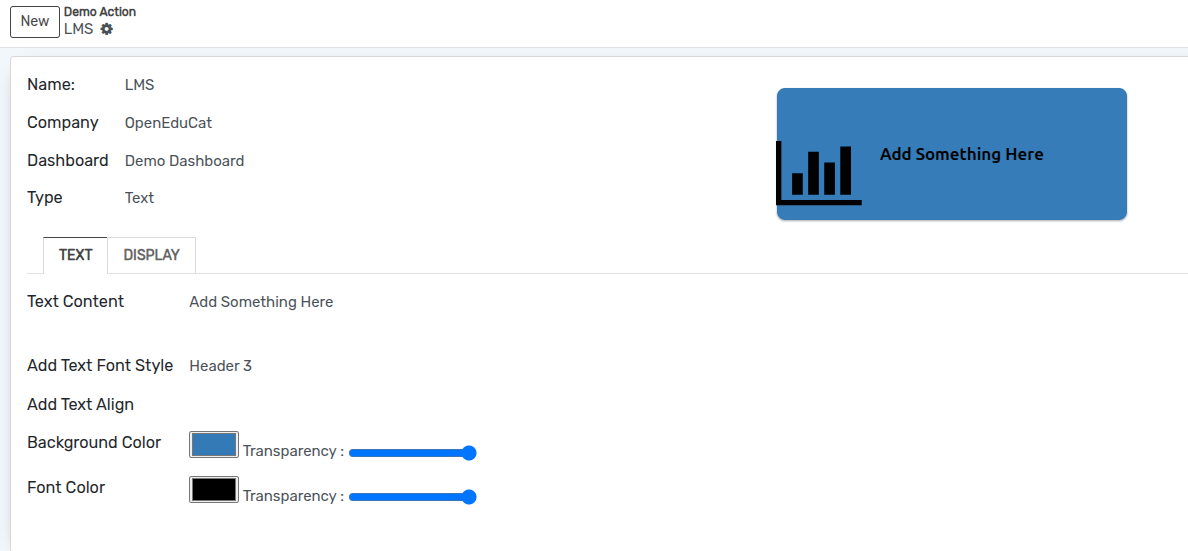
Name :- Specify the name of tile.
Company :- Select the Company from the list.
Dashboard :- Select the dashboard from the list.
Pages
Texte
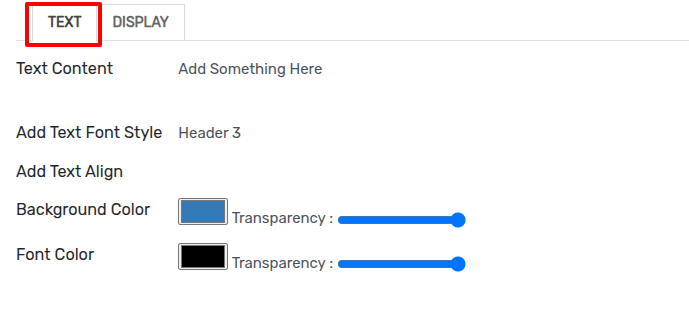
Text Content :- Add a text content of the text box.
Add Text Font Style :- Select the font style for text box from the list.
Add Text Align :- Select the text align from the list.
Vous pouvez également définir la couleur d’arrière-plan et la couleur de la police pour la zone de texte actuelle.
Afficher
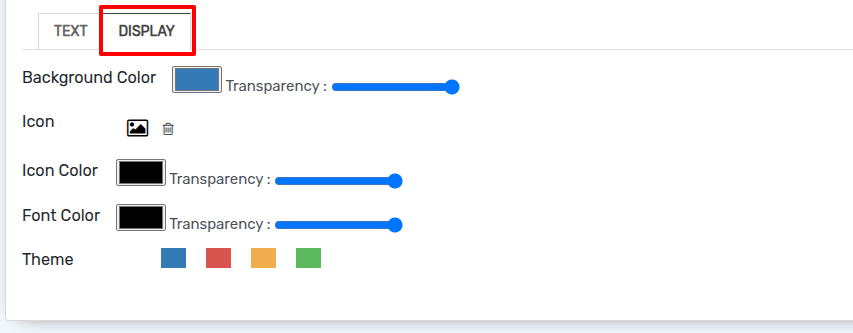
Le tableau de bord KPI permet de sélectionner différentes icônes de la police géniale et vous permet également de sélectionner votre couleur préférée. Il vous permet également de sélectionner la couleur de la police et de l’arrière-plan dans l’onglet d’affichage.
Comment ajouter un lien
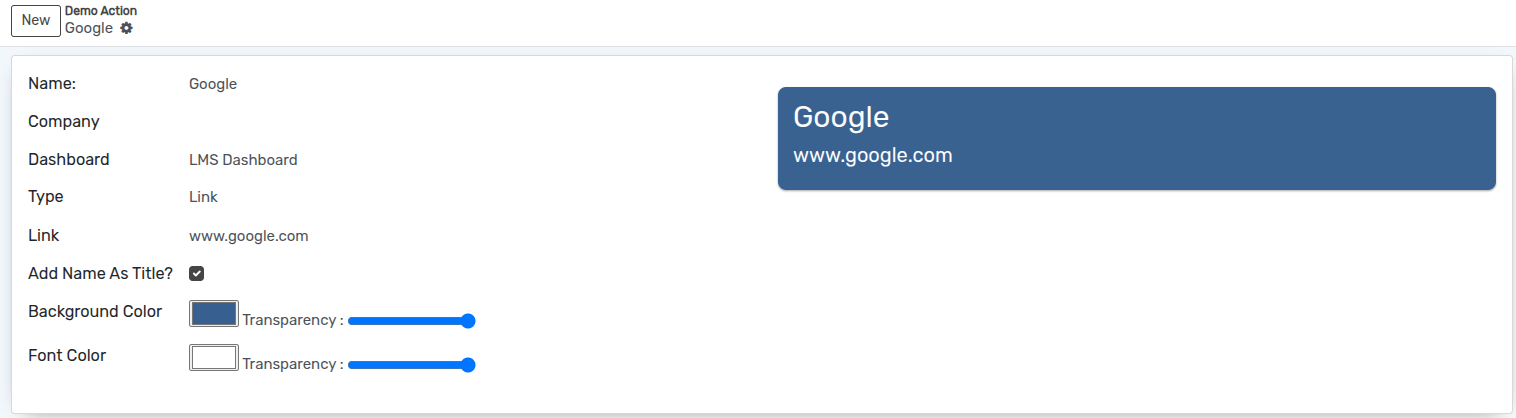
Name :- Specify the name of link.
Company :- Select the Company from the list.
Dashboard :- Select the dashboard from the list.
Link :- Add the link here.
Add Name As Title? :- If you want to use name as title check Add Name As Title checkbox.
Vous pouvez également définir la couleur d’arrière-plan et la couleur de la police pour la zone de lien actuelle.
Comment ajouter un diviseur
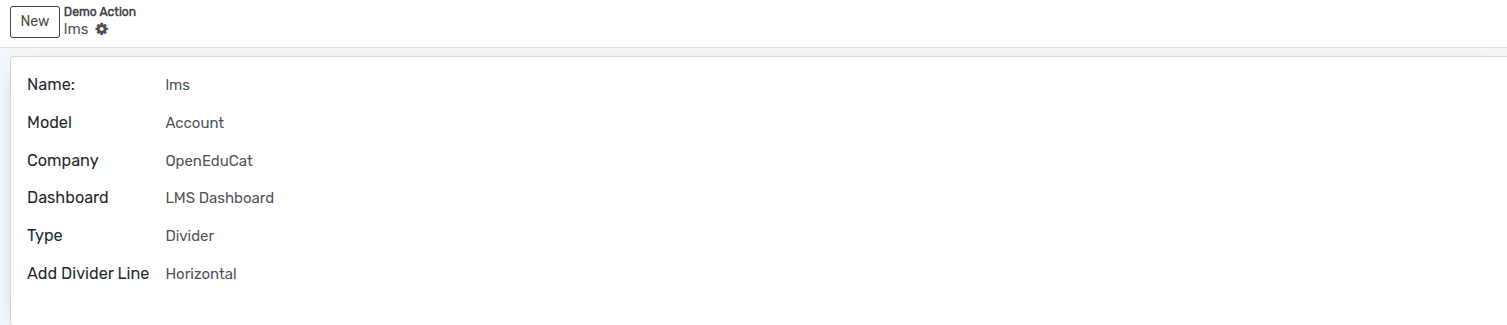
Name :- Specify the name of Divider.
Model :- Select the model from the list.
Company :- Select the Company from the list.
Dashboard :- Select the dashboard from the list.
Add Divider Line :- Select the divider line which is Horizontal or Vertical from the list.
Comment ajouter une image
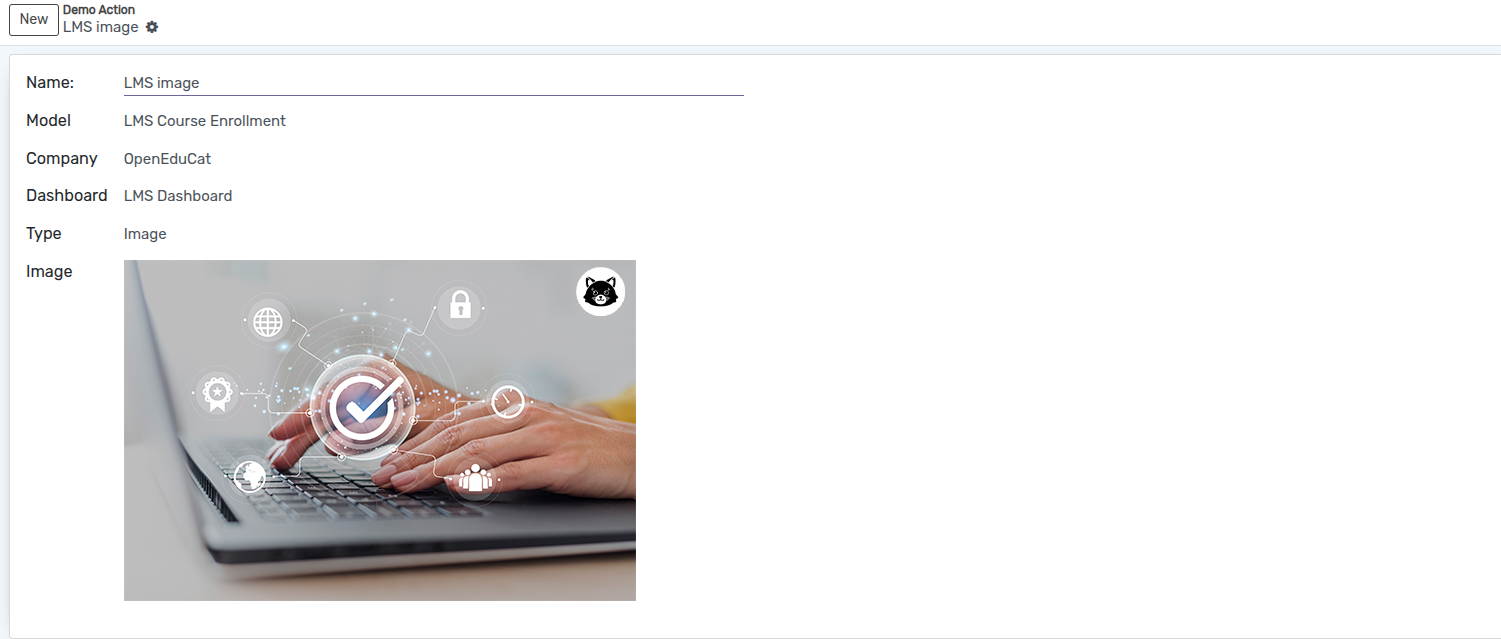
Name :- Specify the name of Image.
Model :- Select the model from the list.
Company :- Select the Company from the list.
Dashboard :- Select the dashboard from the list.
Image :- Add an image which you want to show on dashboard.
Comment ajouter une liste
Le tableau de bord KPI fournit également une vue en liste. Ce qui vous permet d’ajouter différents champs dans la liste. Le tableau de bord KPI vous permet également de personnaliser l’enregistrement individuel de la liste du tableau de bord.
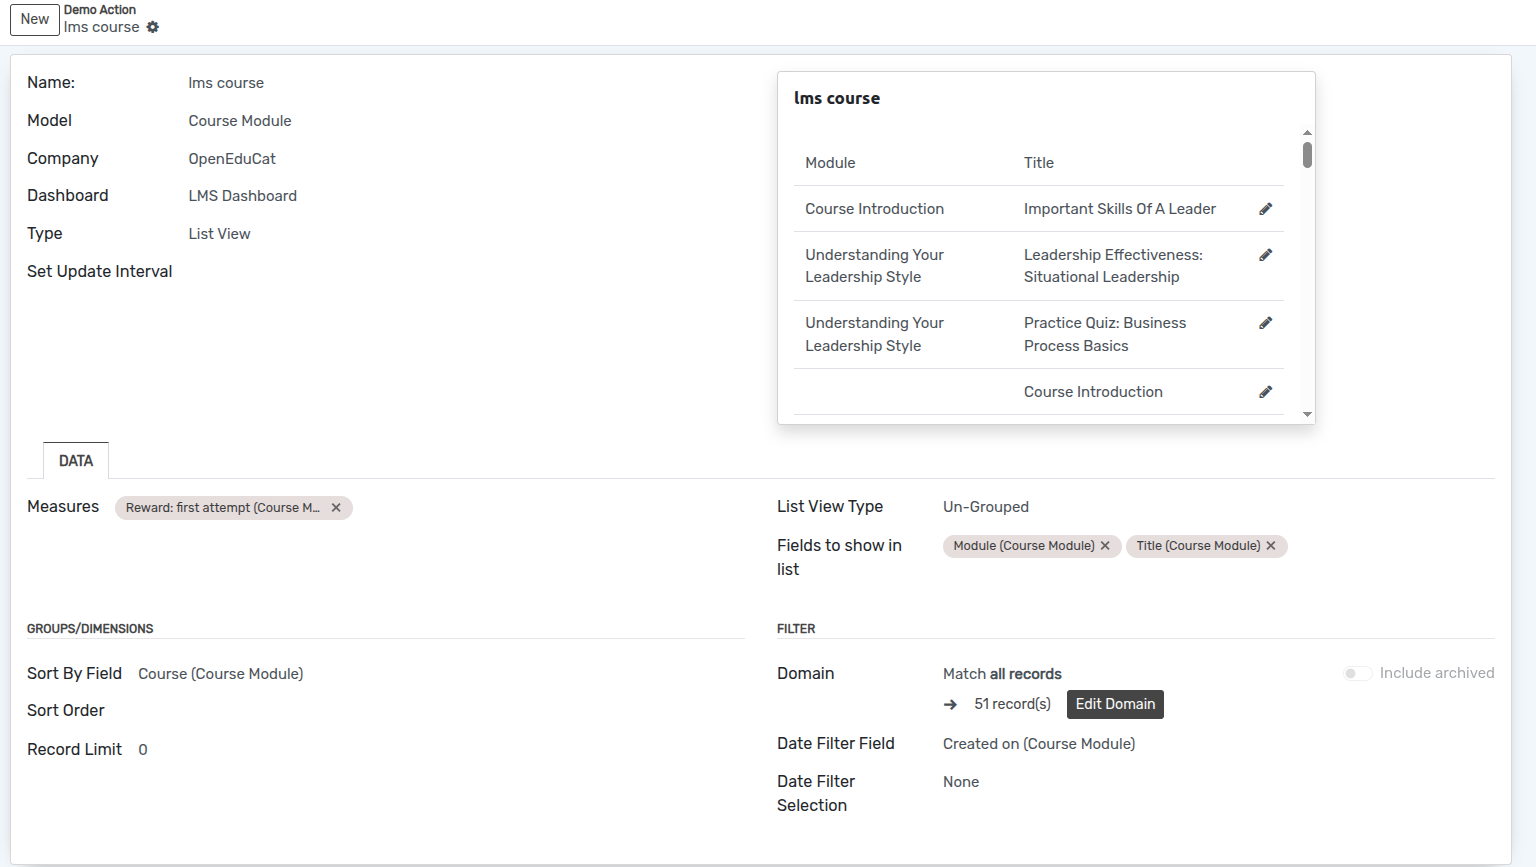
Name :- Specify the name of list.
Model :- Select the model from the list.
Company :- Select the Company from the list.
Dashboard :- Select the dashboard from the list.
Set Update Interval :- Set the update interval time in set update interval field.
Pages
Données
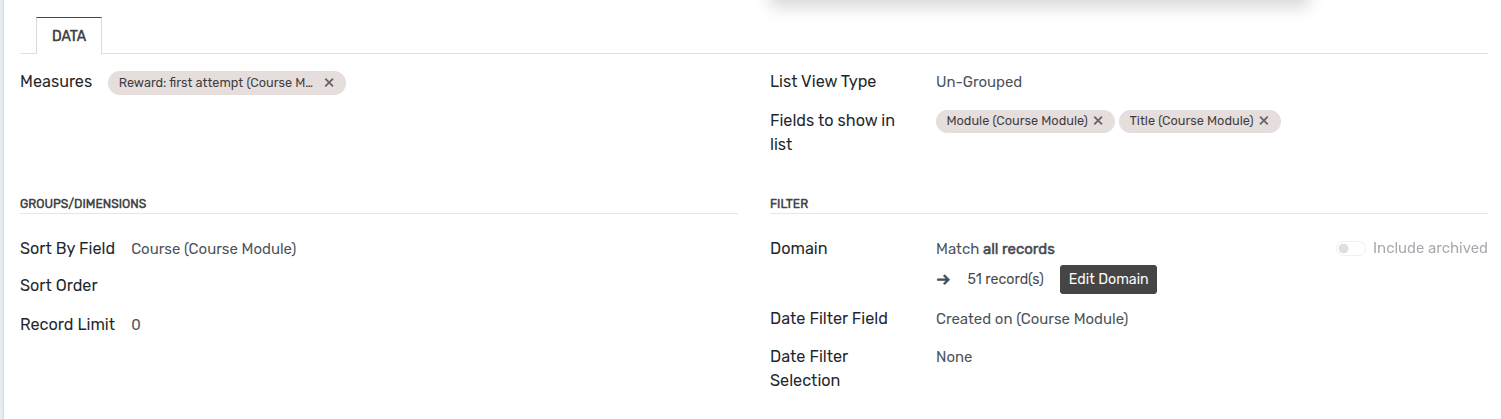
List View Type :- Select the list view type which id grouped or Un-grouped from the list.
Fields to show in list :- Select the fields which are you want to show in list.
Sort By Field :- Select the sort by field from the list.
Sort Order :- Select the sort order which is Ascending or Descending.
Record Limit :- Add the record limit as you want to display.
Domain :- Add domain for current list.
Comment ajouter une liste de tâches
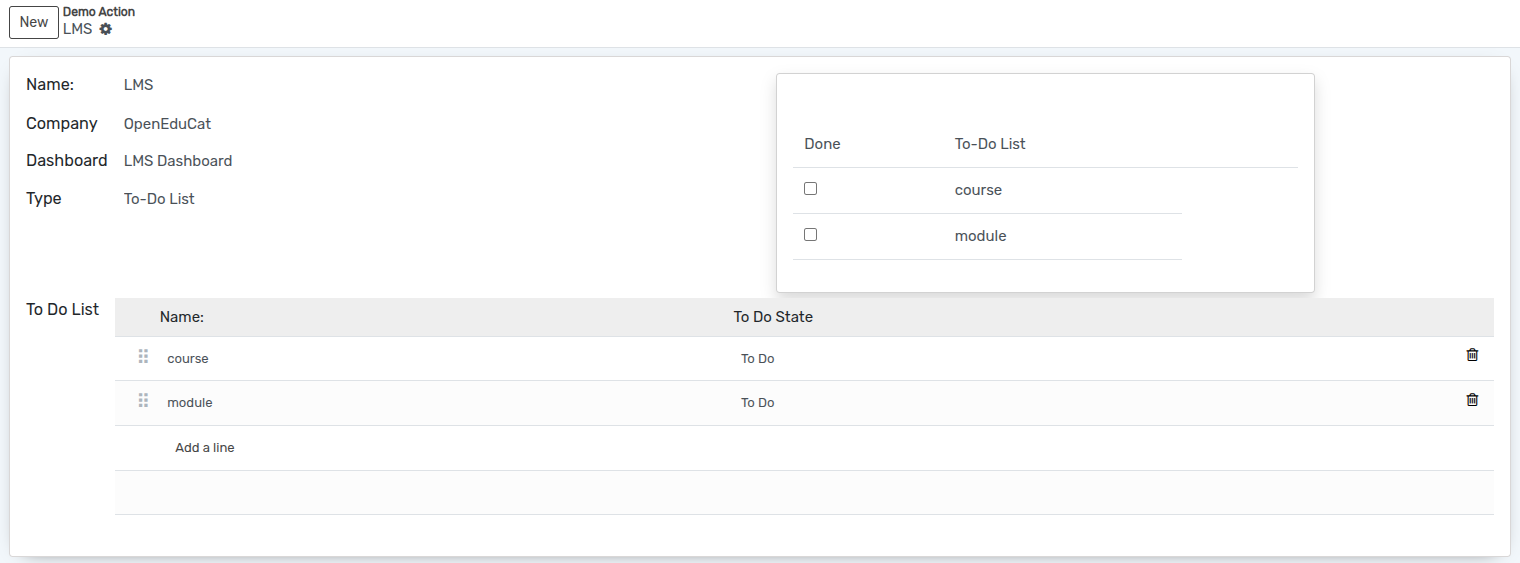
Name :- Specify the name of To-do list.
Company :- Select the Company from the list.
Dashboard :- Select the dashboard from the list.
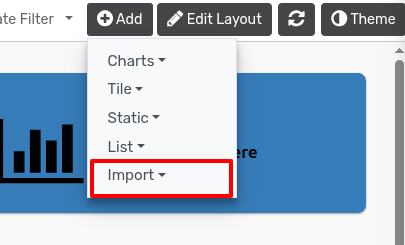
Comment importer/exporter un élément
Vous pouvez exporter le graphique au format Excel, Csv, PDF, image et Json. Le fichier Json peut être importé ultérieurement dans le tableau de bord.
Exporter
Importer