Cómo ..
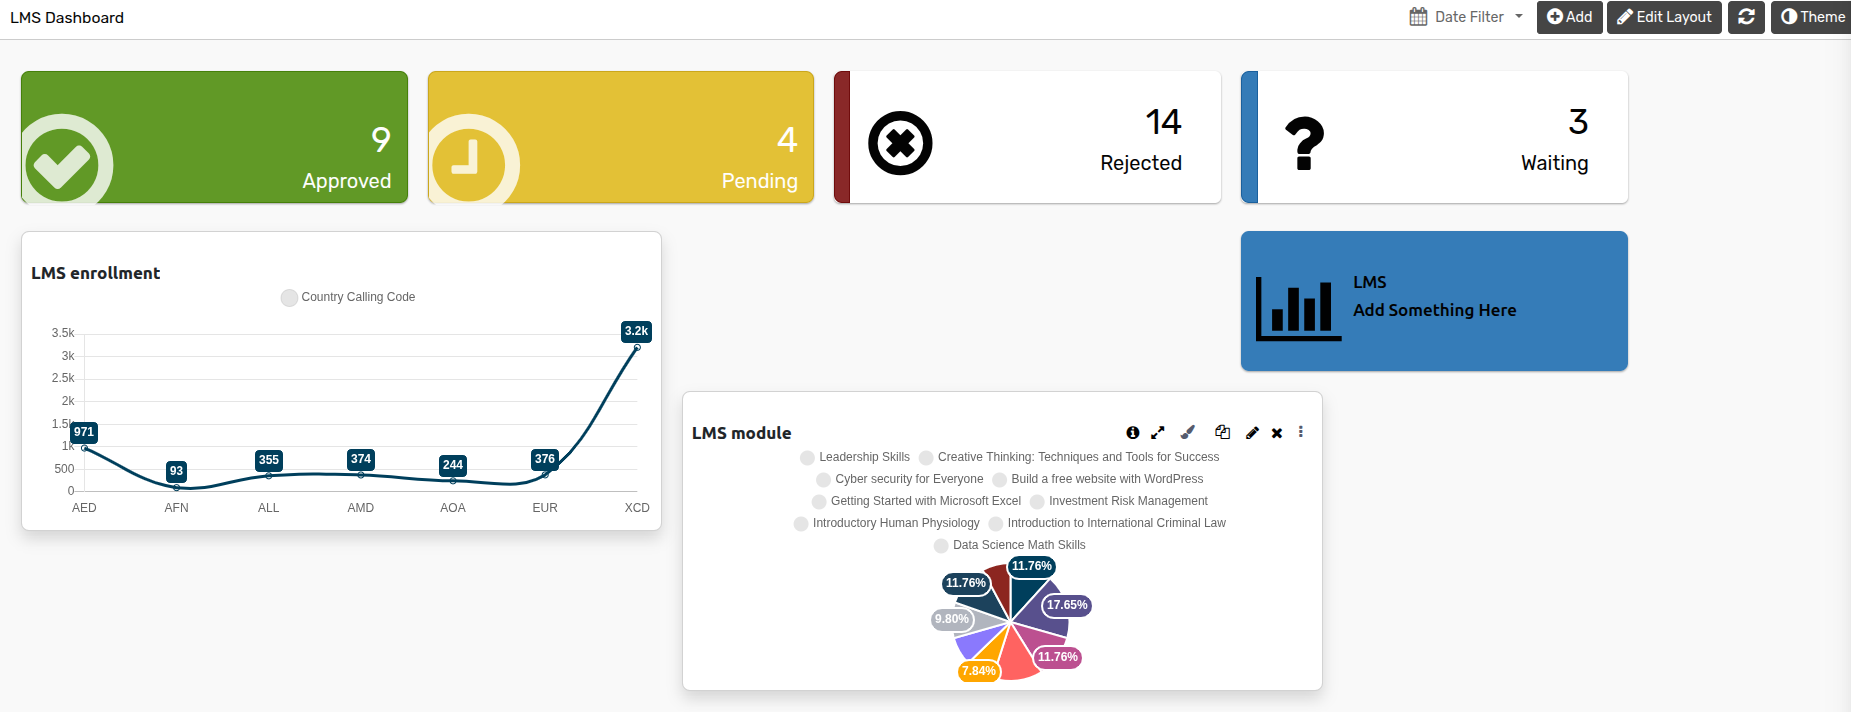
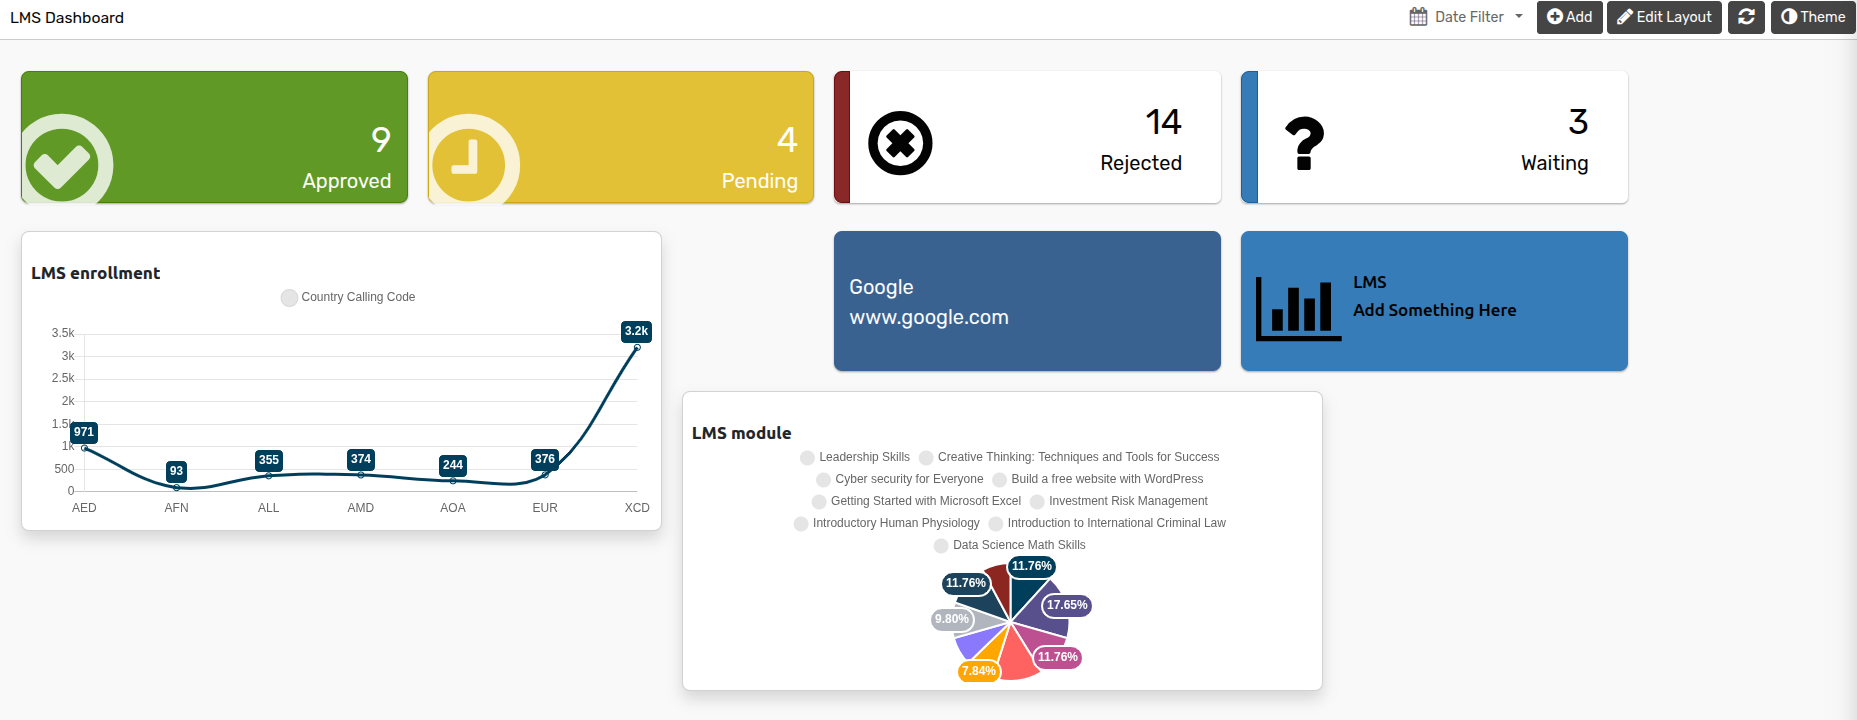
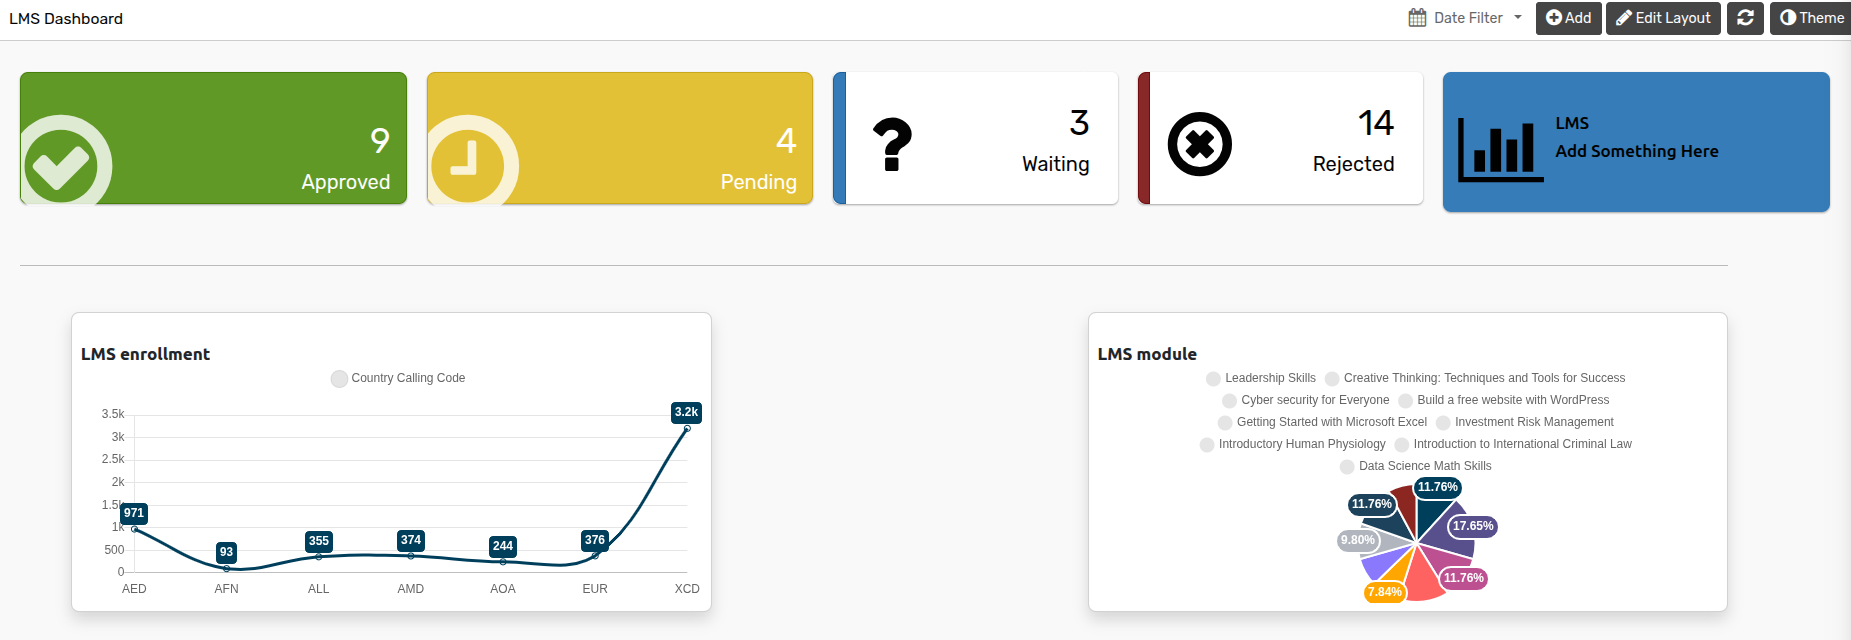
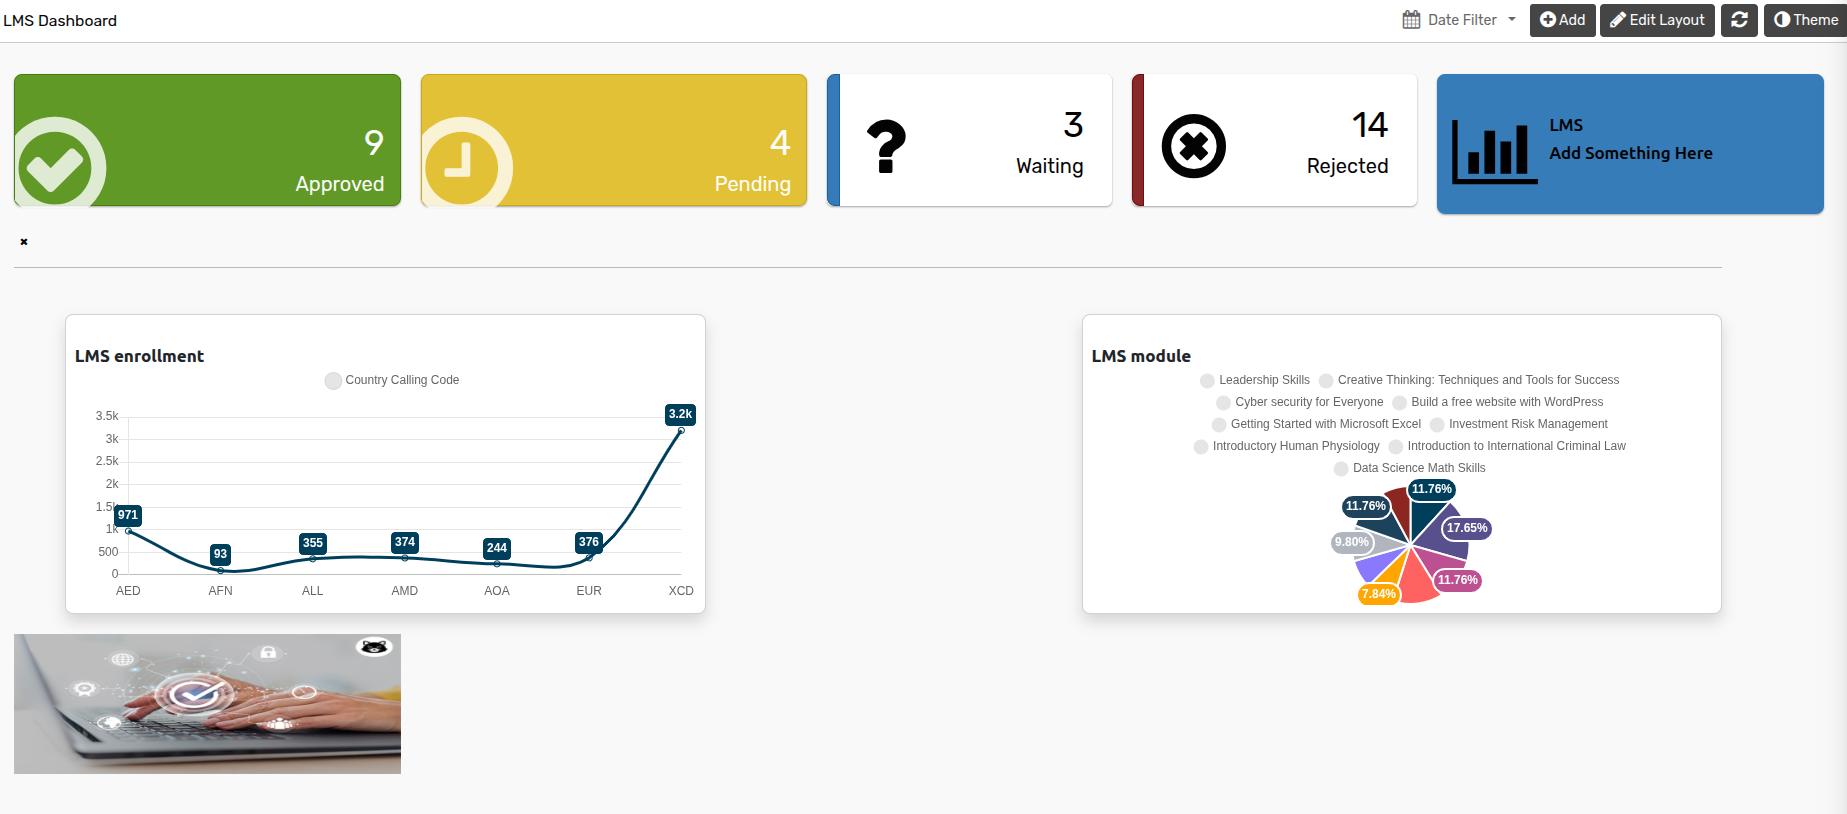
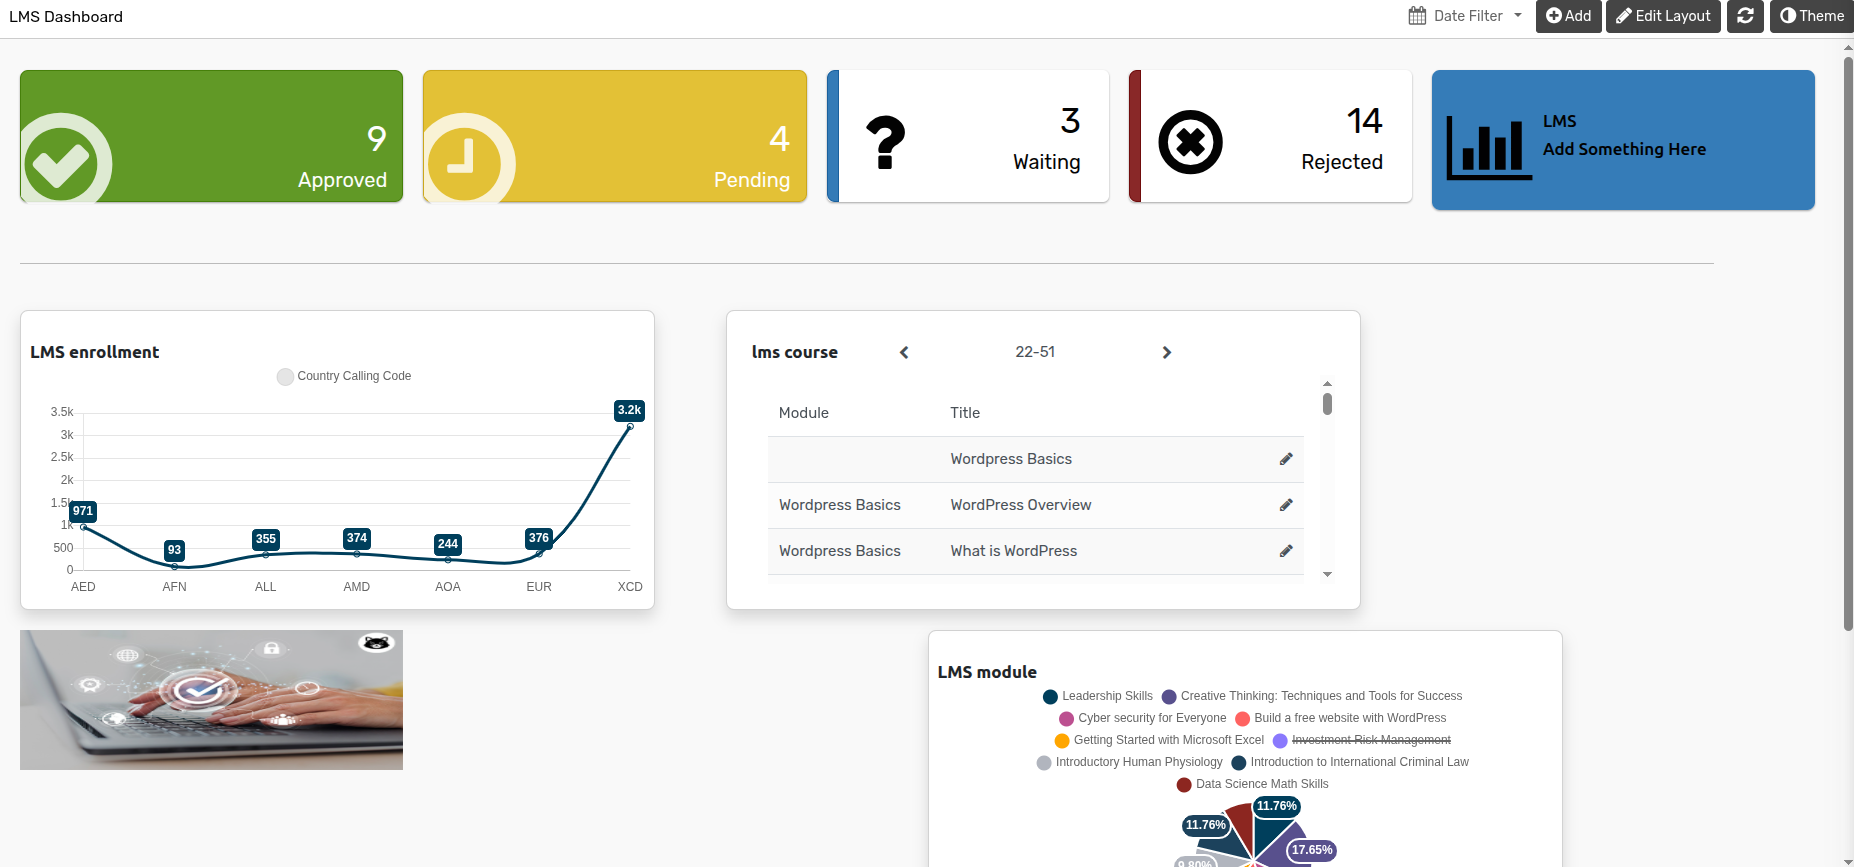
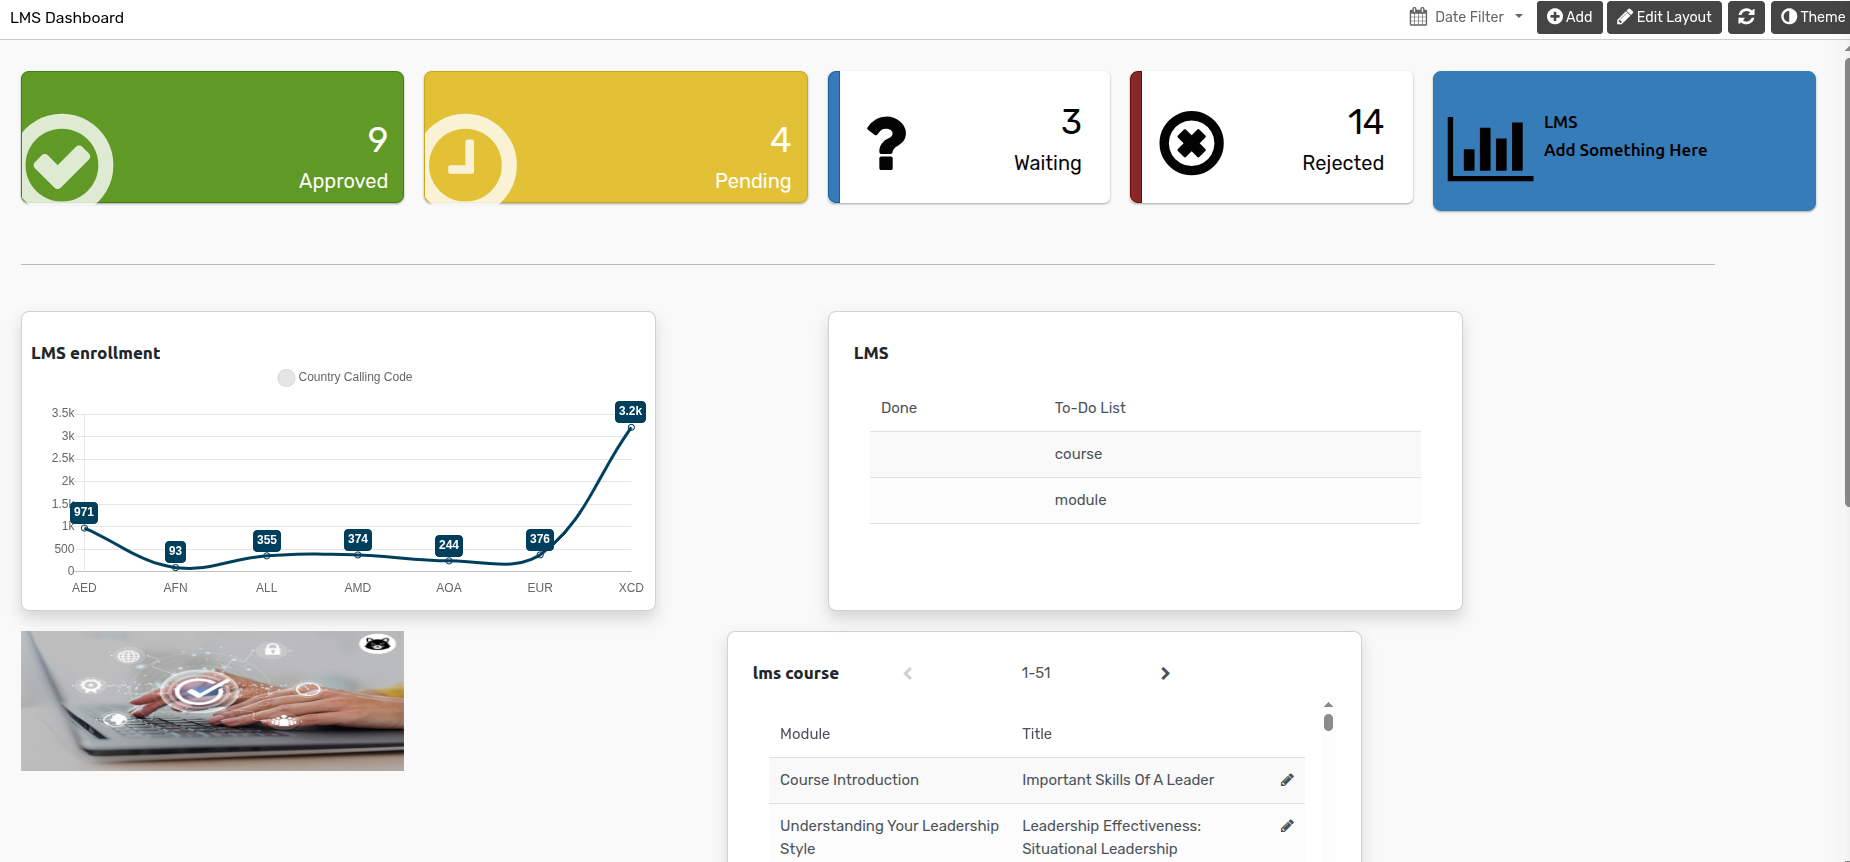
KPI Dashboard le ayuda a controlar sus datos importantes fácilmente. Contiene vista de mosaicos múltiples, vista de Kpi, vista de lista y vista de gráficos múltiples.
Cómo hacer gráficos
You can go to the .
Click on Add button to add charts.
Dashboard Pro proporciona varios tipos de gráficos como barras, barras horizontales, líneas, áreas, circulares, anillos y áreas polares.
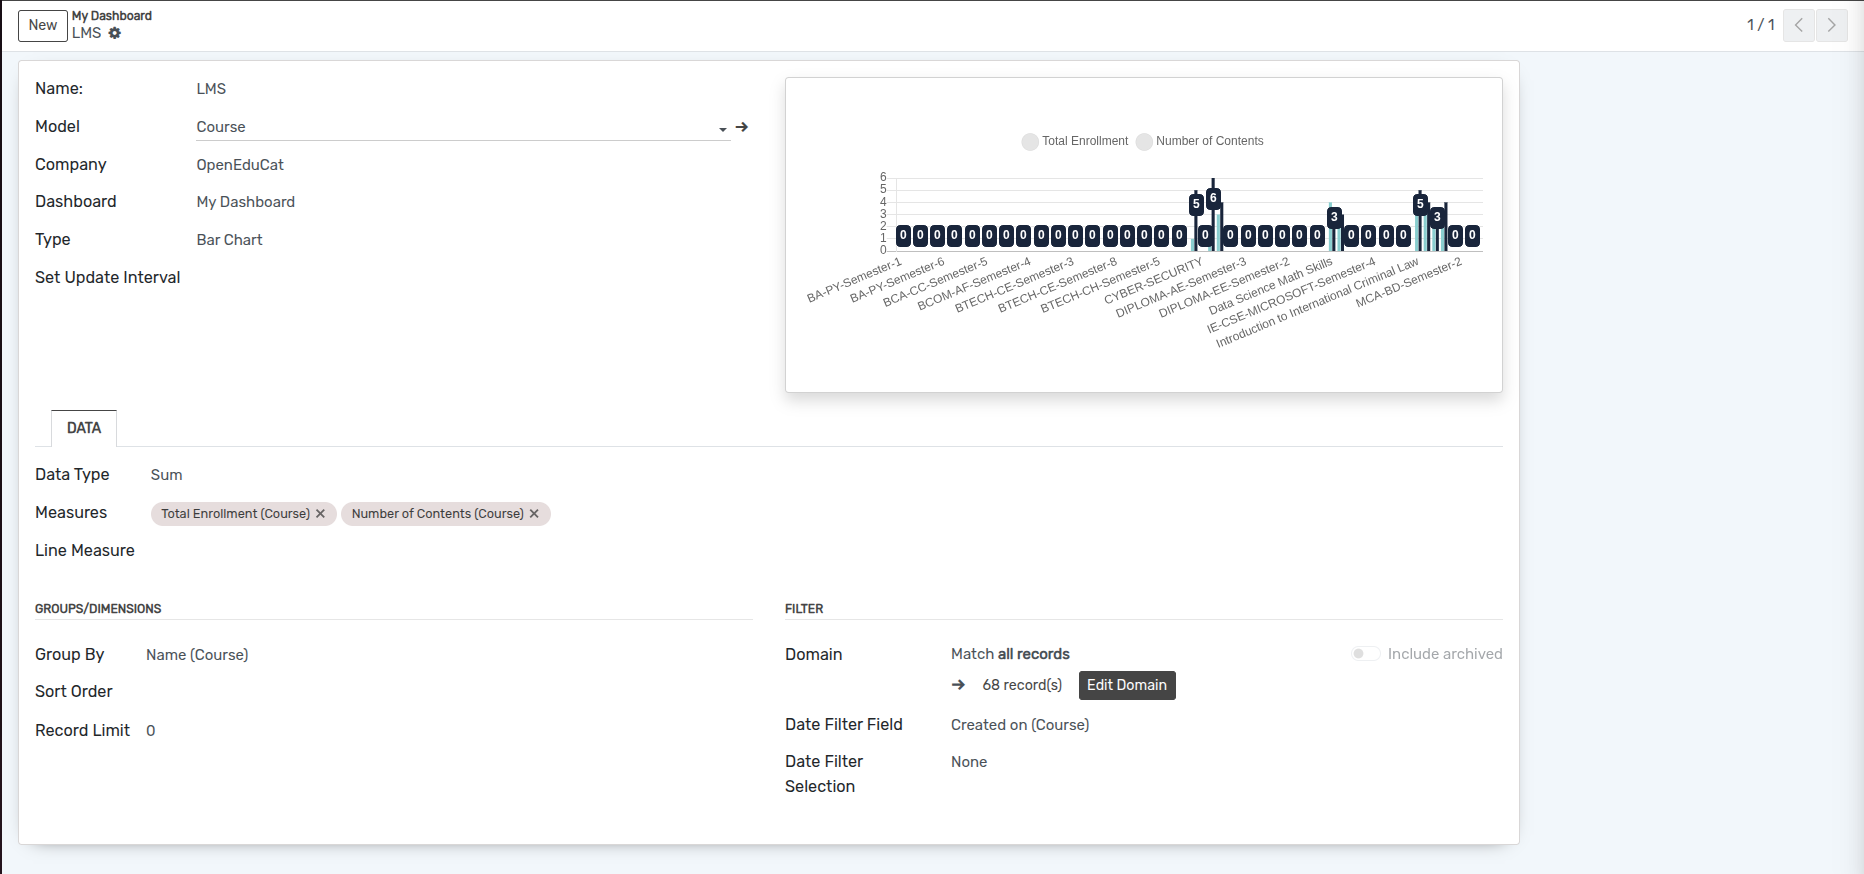
Name :- Specify the name of chart.
Model :- Select the model from the list.
Company :- Select the Company from the list.
Dashboard :- Select the dashboard from the list.
Type :- Select the type of chart from the list.
Set Update Interval :- Set the update interval time in set update interval field.
paginas
Datos
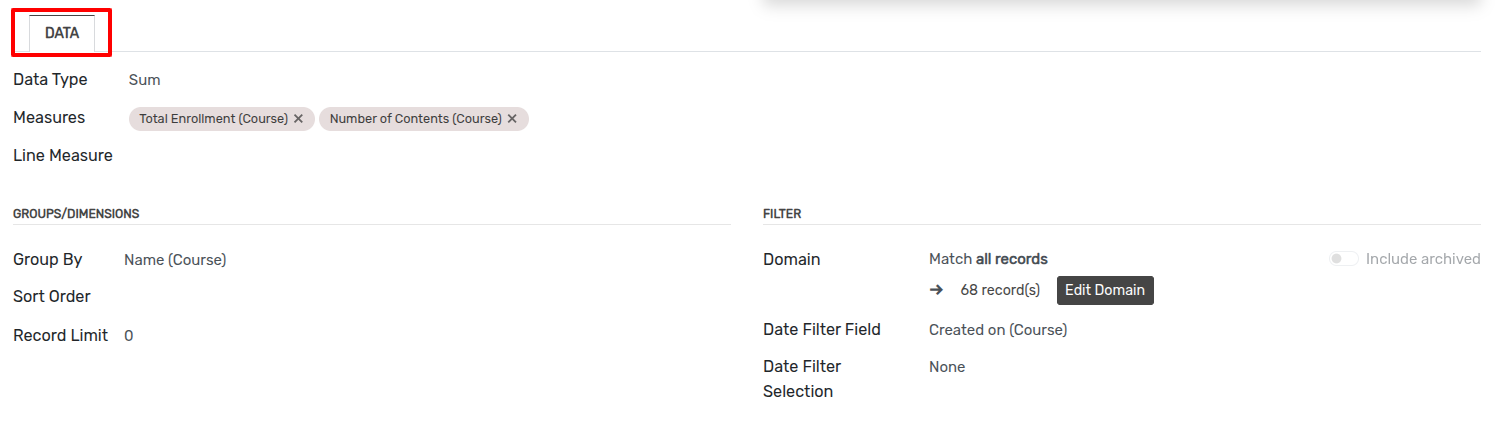
Data type :- select the data type which is sum, count or avarage from the list.
Measures :- Select the Measures of the selected model from the list.
Line Measure :- Select the Line Measures of the selected model from the list.
Group By :- Select the group by which you want to group from the list.
Sort By Field :- Select the sort by field from the list.
Sort Order :- Select the sort order which is Ascending or Descending.
Record Limit :- Add the record limit as you want to display.
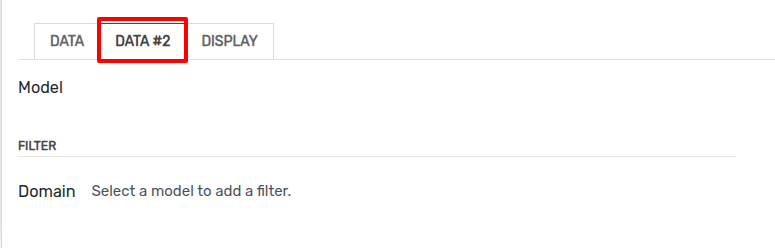
Domain :- Add domain for current chart.
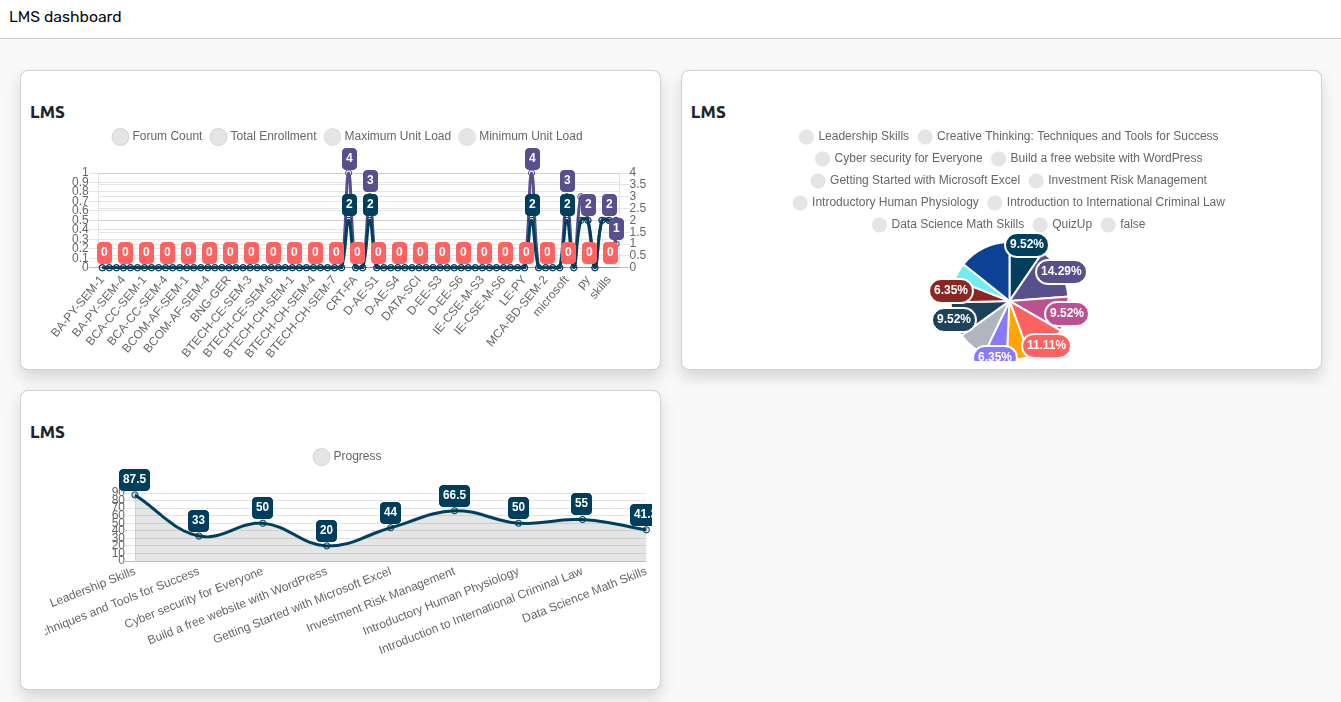
De esta manera puedes crear múltiples gráficos con diferentes tipos.
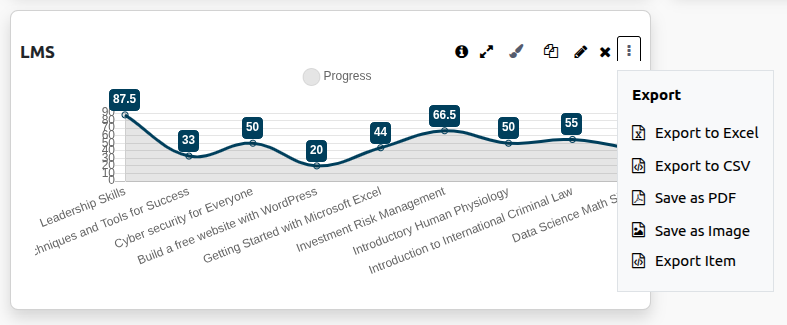
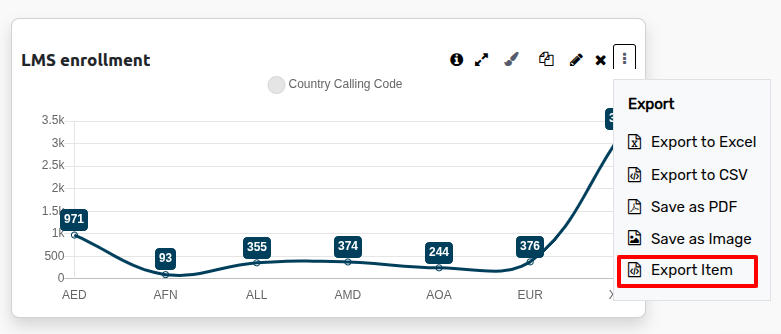
Puede exportar gráficos como Excel, Csv, PDF, imagen y Json. El archivo Json se puede importar al panel más tarde.
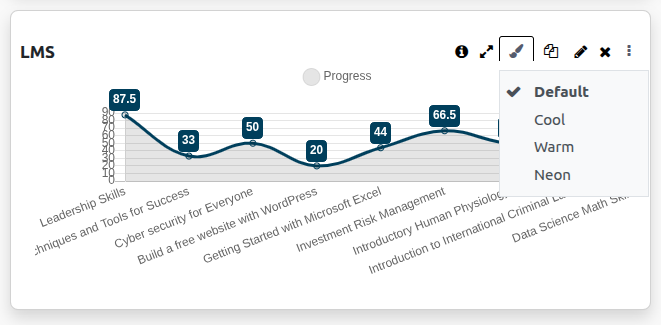
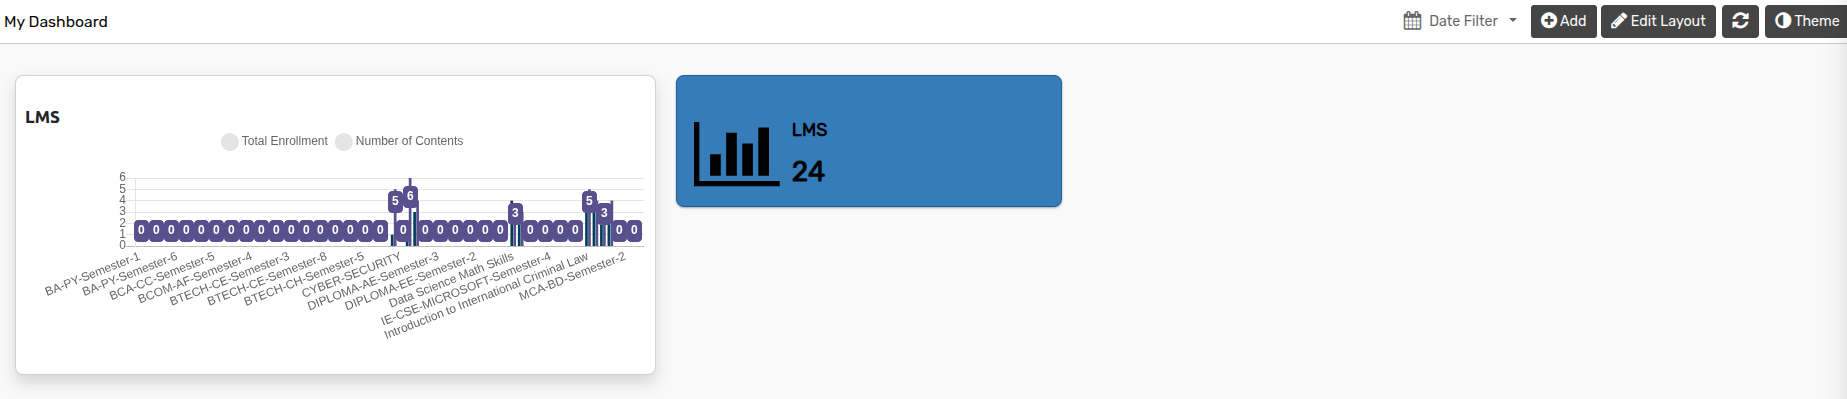
El panel de KPI presenta 4 opciones de color diferentes.
Cómo hacer azulejos
El panel de KPI proporciona diferentes elementos como vista en mosaico y vista de KPI. Hay 6 diseños de mosaicos impresionantes y atractivos.
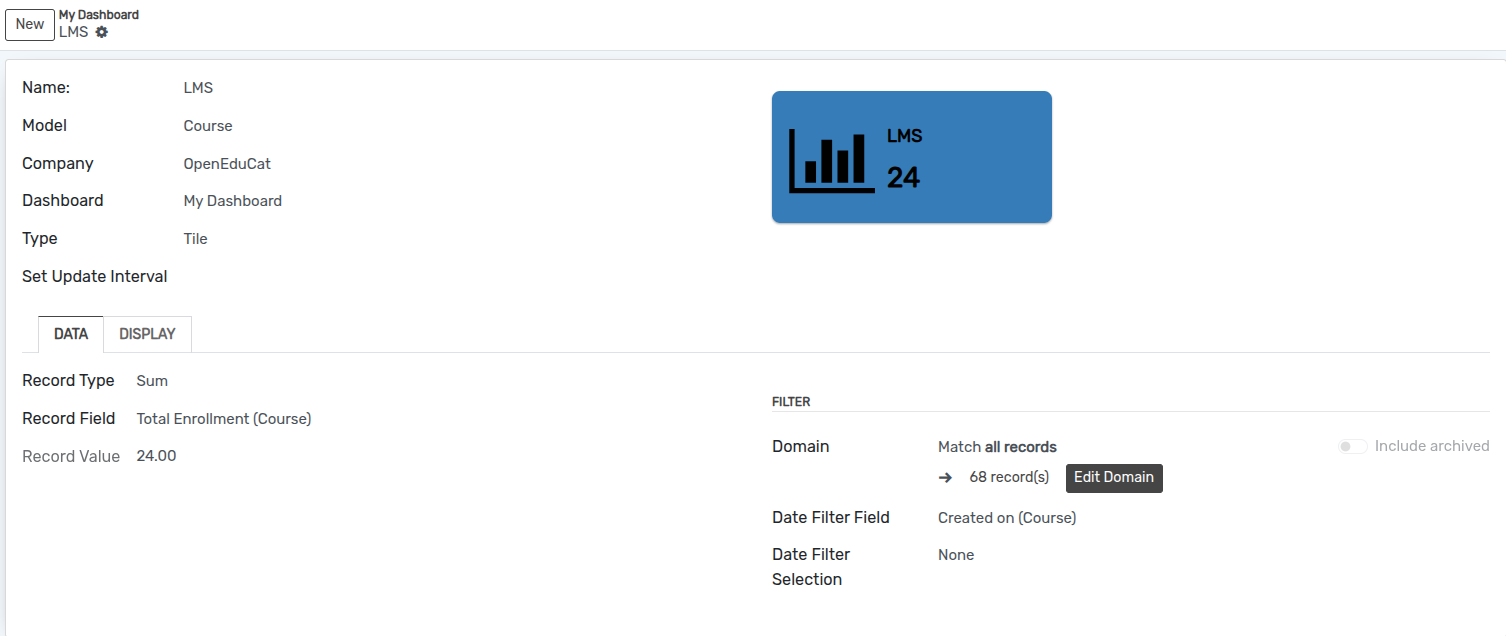
Name :- Specify the name of tile.
Model :- Select the model from the list.
Company :- Select the Company from the list.
Dashboard :- Select the dashboard from the list.
paginas
Datos
El panel de KPI le permite personalizar el título del menú y su valor de diferentes modelos en la pestaña Datos. En la vista KPI, puede seleccionar entre barra de progreso o porcentaje en la pestaña Objetivo. También puedes comparar con otro modelo en suma, proporción y porcentaje.
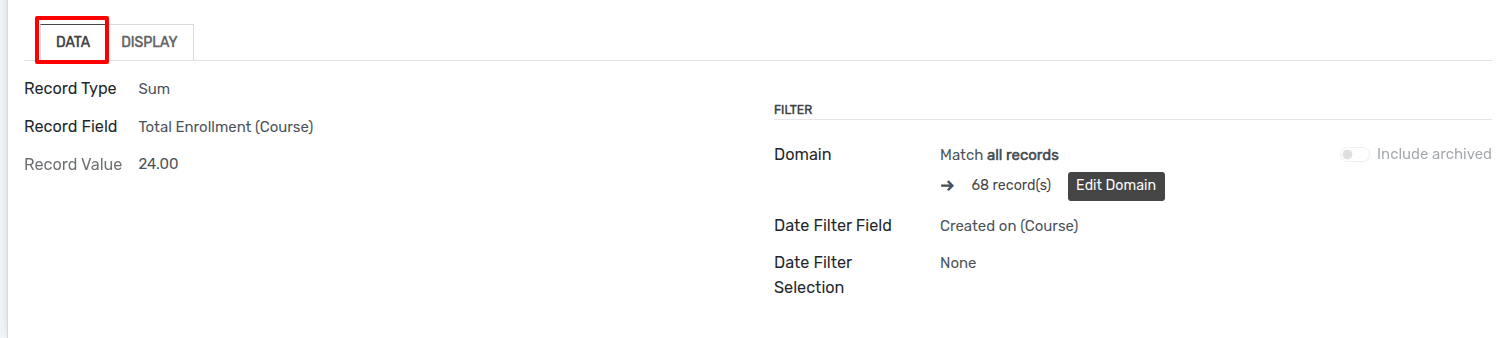
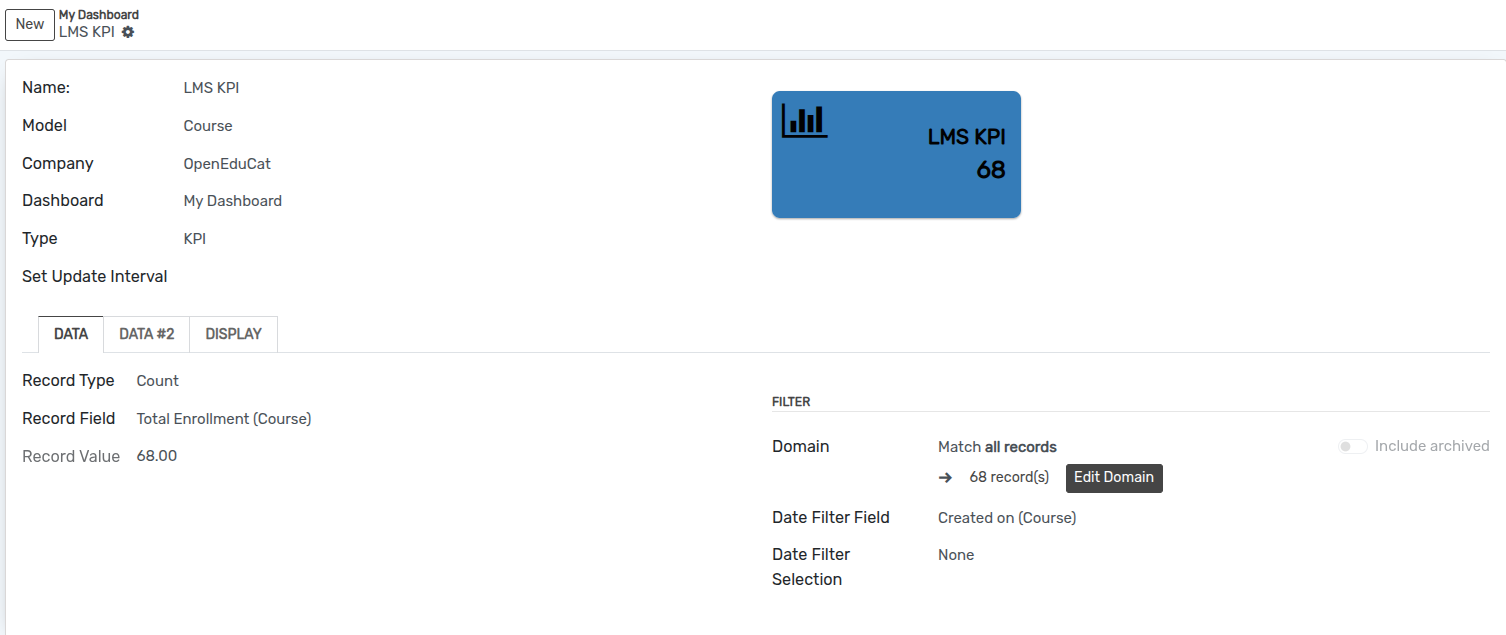
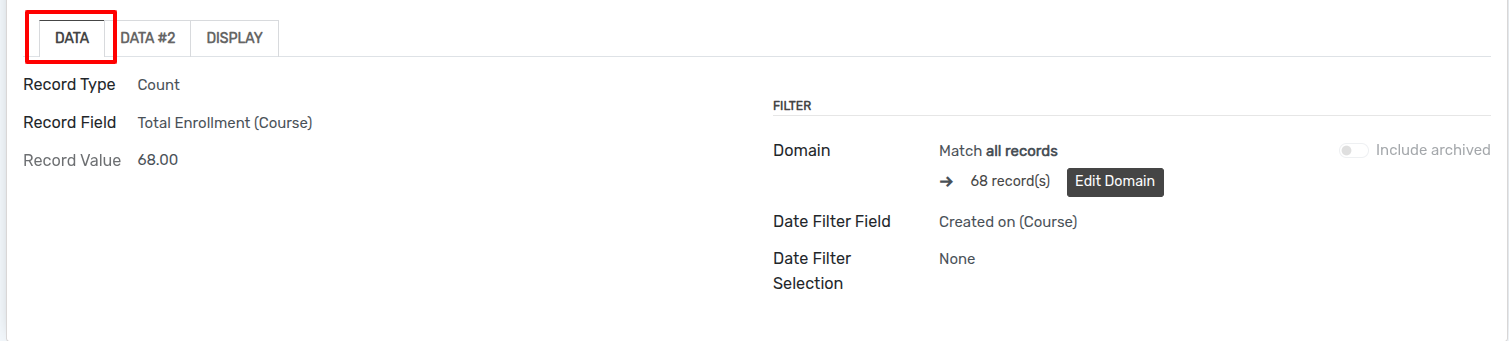
Record Type :- select the data type which is sum, count or avarage from the list.
Record Field :- Select the Record Field based on selected model from the list.
Record Value :- It will automatically add based on selected record field.
Domain :- Add domain for current tile.
Mostrar
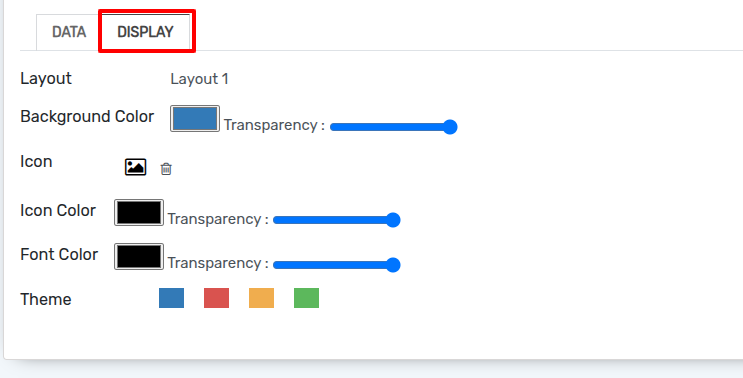
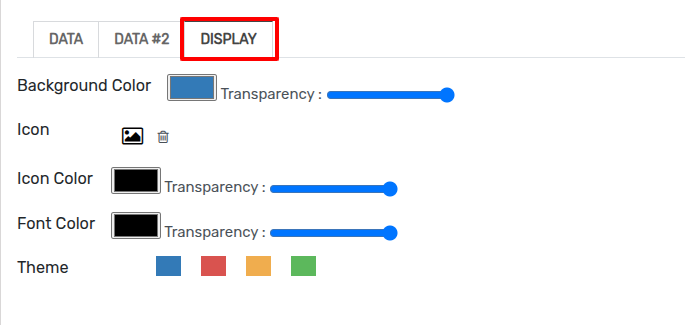
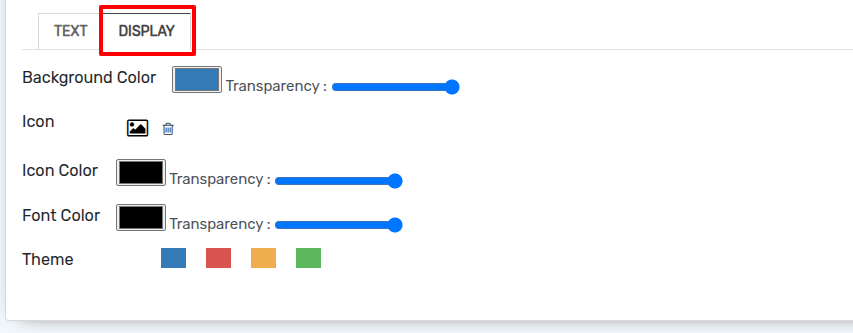
KPI Dashboard permite seleccionar diferentes íconos de la fuente impresionante y también le permite seleccionar su color favorito. También le permite seleccionar el color de la fuente y el fondo desde la pestaña de visualización.
Cómo hacer KPI
Name :- Specify the name of KPI.
Model :- Select the model from the list.
Company :- Select the Company from the list.
Dashboard :- Select the dashboard from the list.
Set Update Interval :- Set the update interval time in set update interval field.
paginas
Datos
Record Type :- select the record type which is sum, count or avarage from the list.
Record Field :- Select the Record Field based on selected model from the list.
Record Value :- It will automatically add based on selected record field.
Domain :- Add domain for current KPI.
Datos 2
Dashboard Pro le permite personalizar el título del menú y su valor de diferentes modelos en la pestaña Datos. En la vista KPI, puede seleccionar entre barra de progreso o porcentaje en la pestaña Objetivo. También puedes comparar con otro modelo en suma, proporción y porcentaje.
Mostrar
KPI Dashboard permite seleccionar diferentes íconos de la fuente impresionante y también le permite seleccionar su color favorito. También le permite seleccionar el color de la fuente y el fondo desde la pestaña de visualización.
Cómo hacer un cuadro de texto
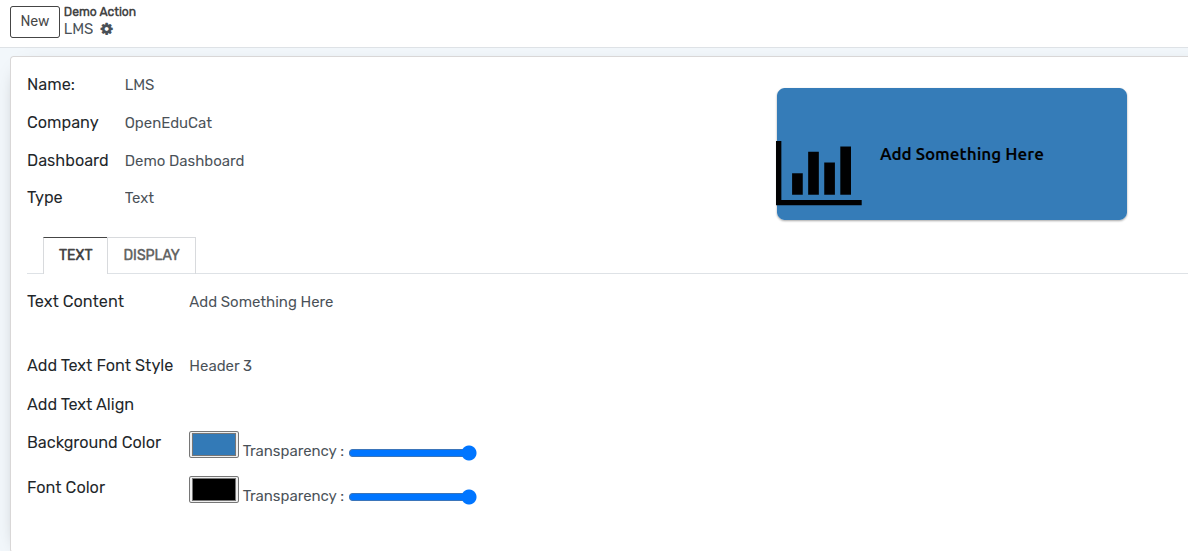
Name :- Specify the name of tile.
Company :- Select the Company from the list.
Dashboard :- Select the dashboard from the list.
paginas
Texto
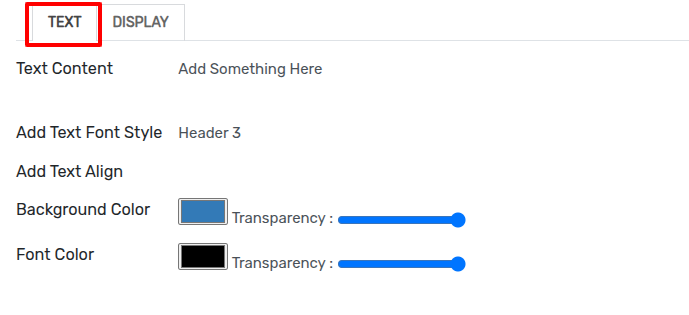
Text Content :- Add a text content of the text box.
Add Text Font Style :- Select the font style for text box from the list.
Add Text Align :- Select the text align from the list.
También puede configurar el color de fondo y el color de fuente para el cuadro de texto actual.
Mostrar
KPI Dashboard permite seleccionar diferentes íconos de la fuente impresionante y también le permite seleccionar su color favorito. También le permite seleccionar el color de la fuente y el fondo desde la pestaña de visualización.
Cómo agregar un enlace
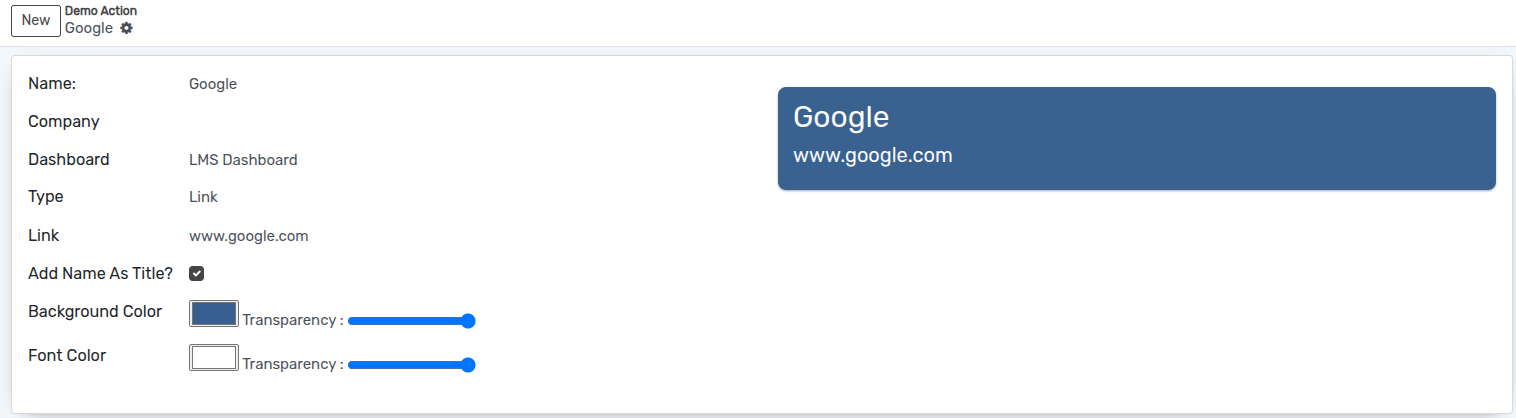
Name :- Specify the name of link.
Company :- Select the Company from the list.
Dashboard :- Select the dashboard from the list.
Link :- Add the link here.
Add Name As Title? :- If you want to use name as title check Add Name As Title checkbox.
También puede configurar el color de fondo y el color de fuente para el cuadro de enlace actual.
Cómo agregar divisor
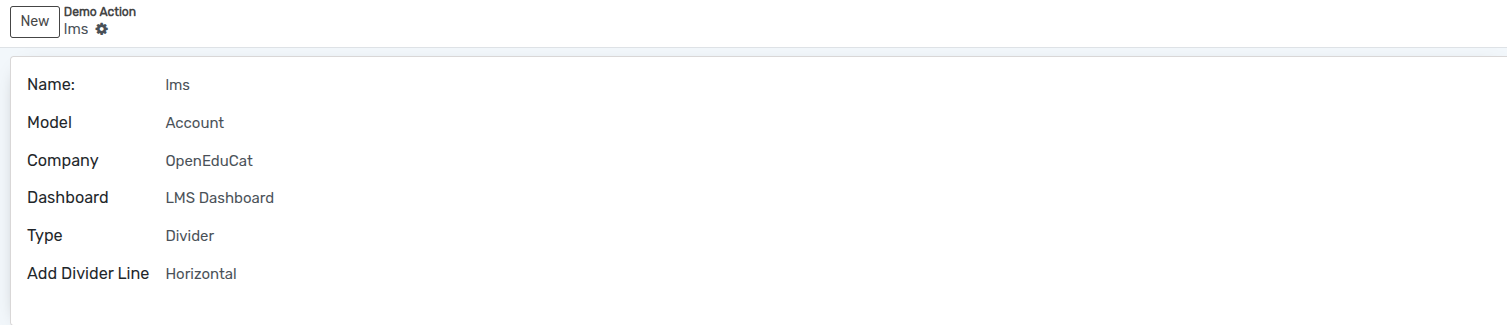
Name :- Specify the name of Divider.
Model :- Select the model from the list.
Company :- Select the Company from the list.
Dashboard :- Select the dashboard from the list.
Add Divider Line :- Select the divider line which is Horizontal or Vertical from the list.
Cómo agregar una imagen
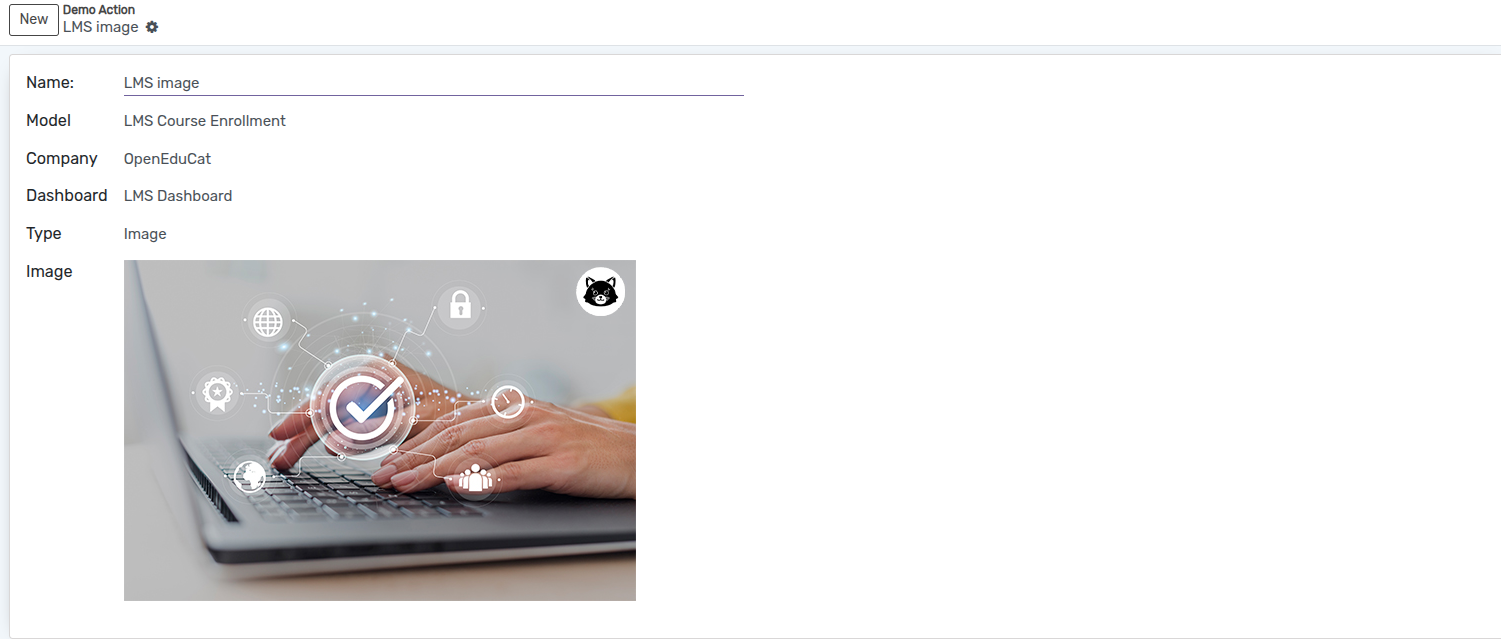
Name :- Specify the name of Image.
Model :- Select the model from the list.
Company :- Select the Company from the list.
Dashboard :- Select the dashboard from the list.
Image :- Add an image which you want to show on dashboard.
Cómo agregar una lista
El panel de KPI también proporciona vista de lista. Lo que le permite agregar diferentes campos en la lista. El panel de KPI también le permite personalizar registros individuales de la lista en el panel.
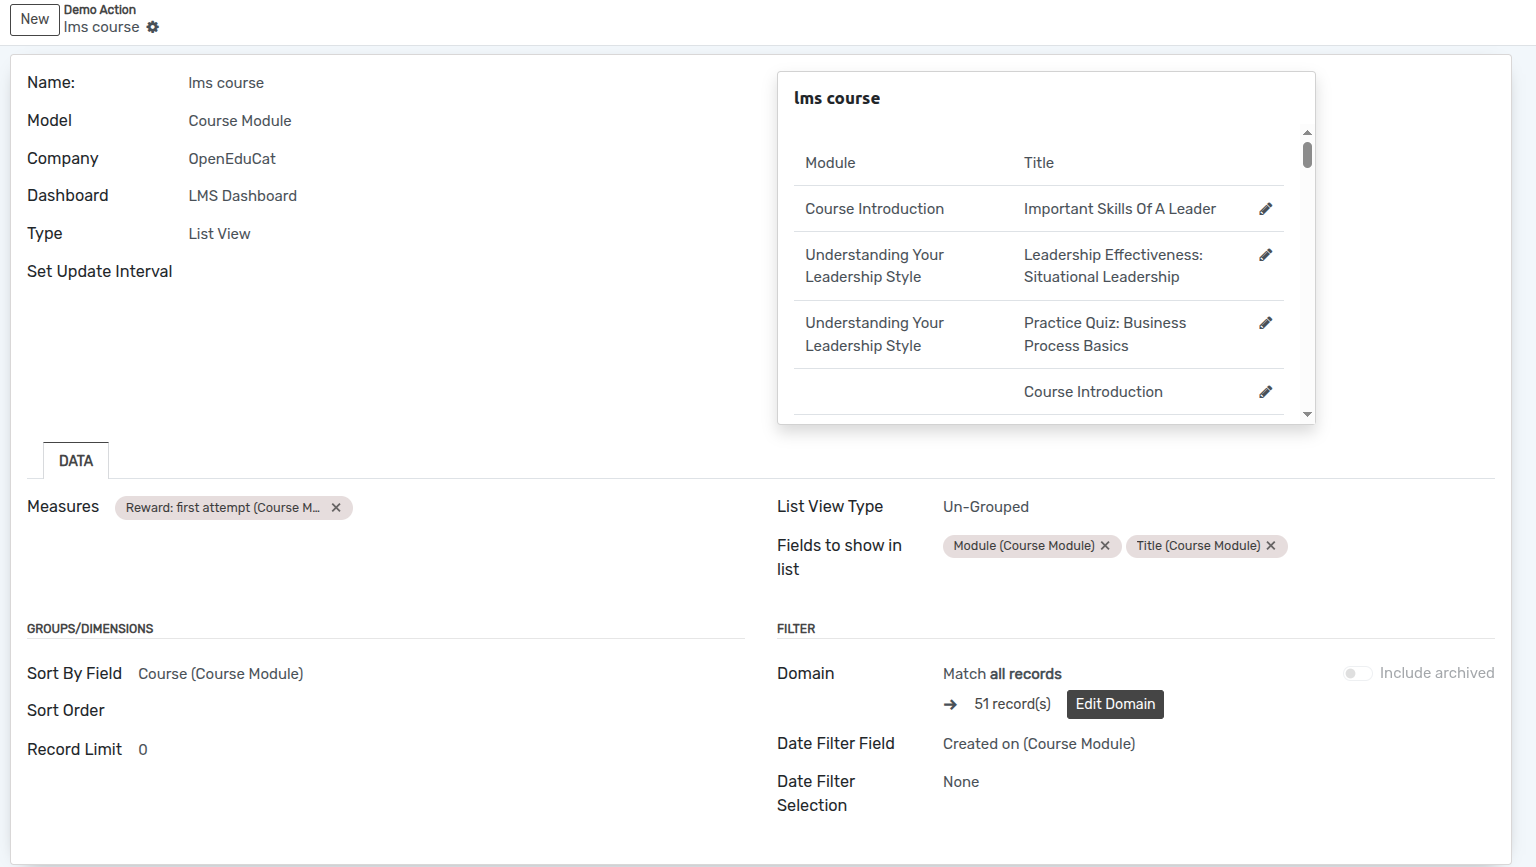
Name :- Specify the name of list.
Model :- Select the model from the list.
Company :- Select the Company from the list.
Dashboard :- Select the dashboard from the list.
Set Update Interval :- Set the update interval time in set update interval field.
paginas
Datos
List View Type :- Select the list view type which id grouped or Un-grouped from the list.
Fields to show in list :- Select the fields which are you want to show in list.
Sort By Field :- Select the sort by field from the list.
Sort Order :- Select the sort order which is Ascending or Descending.
Record Limit :- Add the record limit as you want to display.
Domain :- Add domain for current list.
Cómo agregar una lista de tareas pendientes
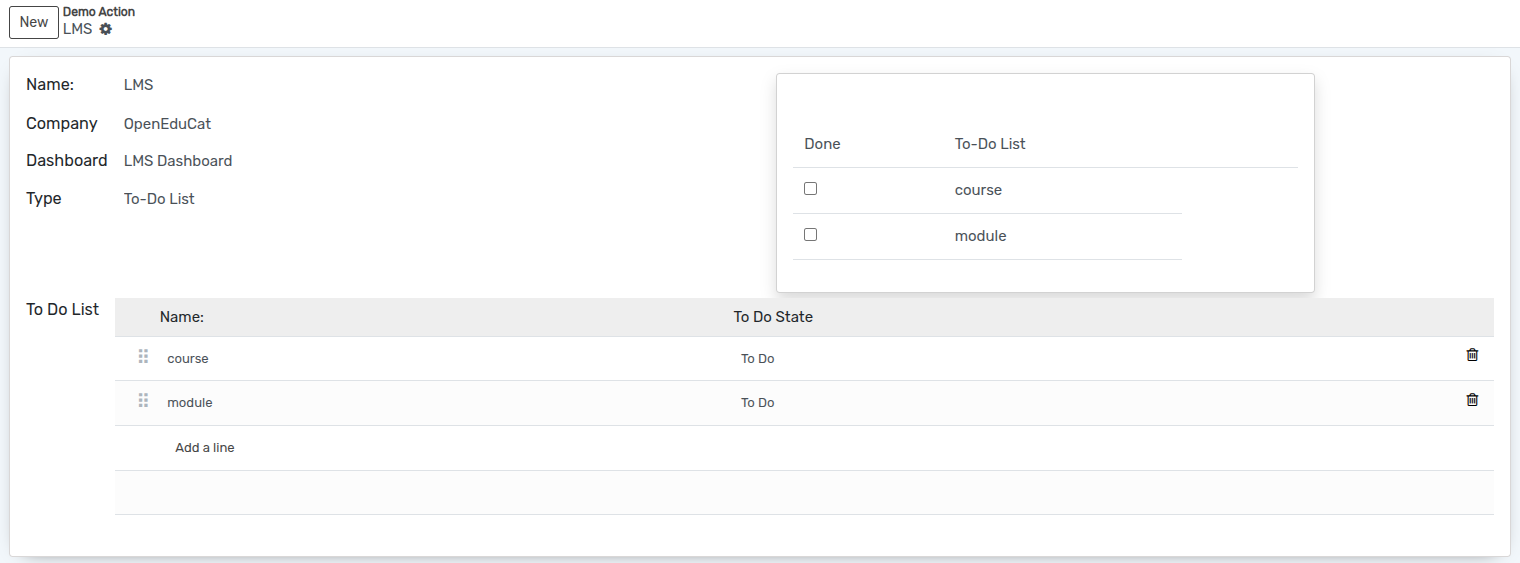
Name :- Specify the name of To-do list.
Company :- Select the Company from the list.
Dashboard :- Select the dashboard from the list.
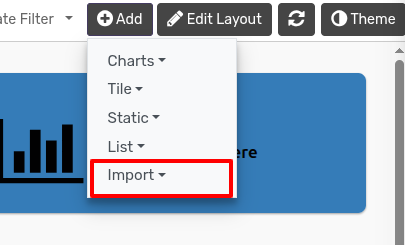
Cómo importar/exportar un elemento
Puede exportar gráficos como Excel, Csv, PDF, imagen y Json. El archivo Json se puede importar al panel más tarde.
Exportar
Importar